In addition, any charts for financial instruments in this article are for education only. The examples shown here do not constitute trading advice or a solicitation to buy or sell any financial instrument. Past performance is not necessarily an indication of future performance.
If you would like to learn more, please read this Disclaimer for details.
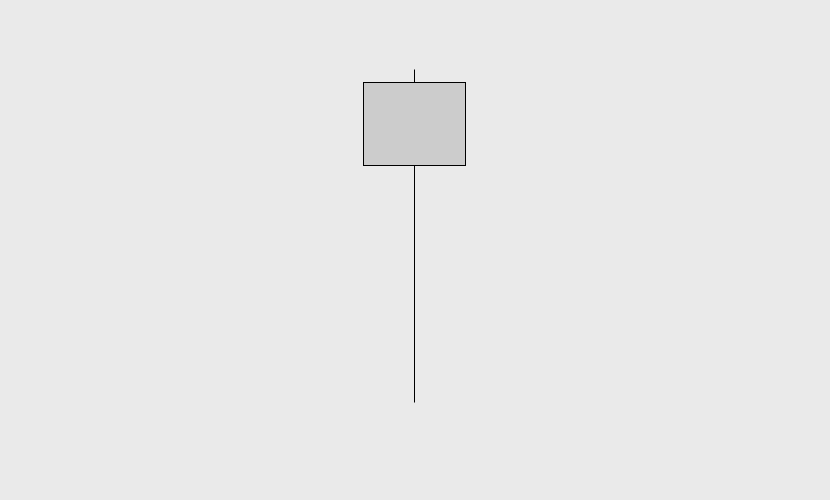
The hanging man is a single candle pattern with the same shape as the hammer. It gets its name from the fact that it has a candle body near the top and a long lower wick, resembling a man hanging in the air. Knowing this, you can probably guess where to look for it.
If this candle appears after an extended bullish run, it tells traders of an increase in selling near the highs of the trend.
In this article, we will explain everything you should know about the hanging man, and how to use it in your trading.
How to Identify a Valid Hanging Man Candlestick
The hanging man is essentially a hammer candle, suspended near the highs of a bullish trend. The shape is the same as a traditional hammer, but it implies increased bearishness instead. After a run up, the market begins to lose strength as buyers back out and sellers force price to stall. As this candle forms, traders notice that price is unable to break through the highs of the candle. In addition, during the candle, a lower wick forms as sellers find momentary success in pushing price back down.
When identifying the hanging man by its shape, we check the same criteria used with the hammer.
1) The shape of the candle and the size of its wicks.
Just like with the hammer, look for the following two signs:
- The candle body is small and the lower wick is larger than the body.
- It has a small or no upper wick.
As with the other hammer variations, experienced traders can identify a valid hanging man by the look of it. The 2:1 wick to body ratio still applies, but it is not always necessary.
2) Rising price leading up to the hanging man.
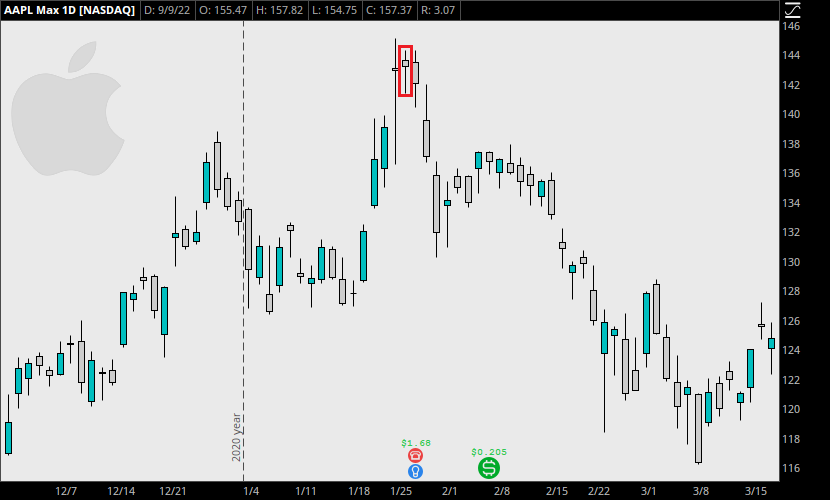
When the market is in an uptrend and this candle appears at the highs, it is a powerful clue that buyers are struggling to push price further. In this example above, there are actually two candles that loosely qualify as hanging man patterns. The candle left of the box shows the extreme change that took place after the previous 3 bullish candles. The price ran up quickly, and then immediately hit a wall, with buyers unable to push price any further. Sellers also managed to take price down to $136.54 per share when price originally opened at $143.07.
If the hanging man occurs somewhere other than after a strong uptrend, it is less reliable.
The Psychology Behind the Hanging Man Candlestick
The arrival of a hanging man in an uptrend is a sign of increased selling pressure. Consider what is happening within the candle to form the final shape.
The market opens, and buyers try to push price up. But shortly after the open, the high has already been made. Sellers push back, forcing price down to create the lows. As buyers attempt to maintain their control, the larger lower wick forms and price recovers slightly. When the candle closes, the price stays in roughly the same place it opened.
The chart below shows S&P 500 futures (/ES) in 2013. For a few days, buyers rapidly drive price up from 1970.00 to over 2080.00. Just before the end of the calendar year, a hanging man appears, suspended at the highs of this steep climb.
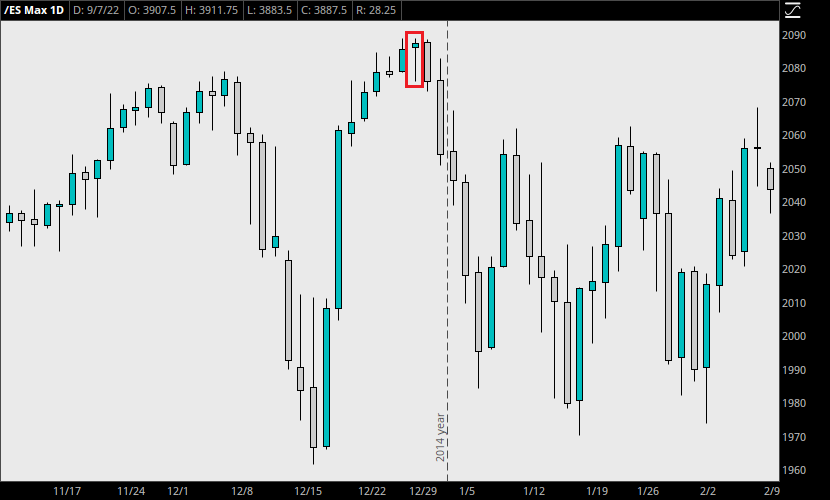
Immediately after the close of this candle, a bearish candle with a large body is made. The market has already begun selling off. In the next 4 days, the market crashes violently, back to the high 1900s.
For traders that noticed this pattern, it was a powerful indication to exit any long positions or to go short, to try to capitalize on the increased selling pressure.
How to Increase the Reliability of the Hanging Man
While it is still a sign of increased bearishness, a weaker hanging man might only cause the market to pause momentarily. During an especially powerful bullish trend, a single hanging man candle may only signal some consolidation before the trend continues.
Traders who aim to improve its effectiveness as a bearish reversal pattern can try a few different things.
1) Evaluate whether the candle itself is bullish.
A valid hanging man might close bullish, bearish, or as a doji. Traders tend to consider a doji or bearish close with a long wick more promising. With a large bullish body, it may be questionable in certain contexts.
2) Analyze the types of candles occurring around it.
What’s happening around the time the hanging man appears? If the market is trending consistently, consider looking for other factors before taking any trades.
If the market is slowing down on its trend, and continually making new highs with weaker candles, there is a clear increase in selling pressure. When a bearish hanging man forms in these conditions, it may be the final failed attempt by buyers to push price higher.
3) Wait for confirmation from the next candle.
As with other patterns, some traders might wait to see the next candle close bearish as well. If a gravestone doji appears, and the market immediately plunges downward, this indicates a clear shift in trader sentiment.
4) Combine the gravestone doji with another candlestick pattern.
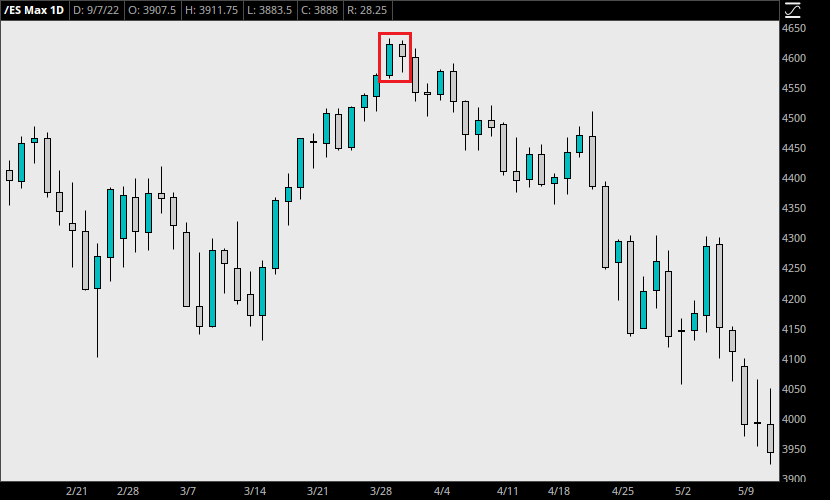
In the following chart of /ES, we see the market trended upward for some time. But take a closer look. The candle bodies were gradually shrinking as the market approached the top, before the hanging man finally formed. In addition, the hanging man created a bearish harami at the same time, with the bullish candle to its left. This made this pattern even more reliable, as it showed another signal of weakness at this level. The market collapsed since this point, and has not yet recovered at the time of writing this article.
How to Trade Using the Gravestone Doji Candlestick Pattern
This candle is most effective while looking for a powerful bearish reversal. Sometimes, it can aid in exiting a long position at a convenient time, too. The market might have reached too high of a price in one trading session, leaving buyers exhausted at the new levels. When a gravestone doji forms, smart technical traders make a note of it and consider closing their long positions rather than leaving it up to chance.
Example Trade
Take a look at the following chart of Amazon (AMZN), depicting daily candles from February 3 to May 19, 2022.
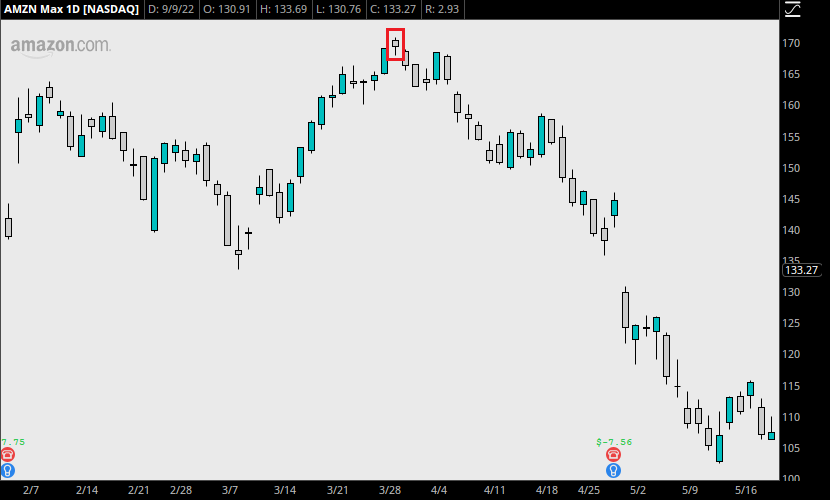
AMZN stock rose from $133.57 to $170.83 per share in about 3 weeks. As the bullish candles shrank in size, there were some dojis forming along the way. Finally, a hanging man forms after price gaps up on March 29. This candle closes bearish. Even with a bit of an upper wick and not a prominent lower wick, the T shape is visible.
Immediately after, the market closes bearish again the next three days.
A trader who understands the hanging man candlestick pattern knows that this bullish trend is showing weakness. If they are long, they could take an exit anywhere above $160 based on the candles shown above. Exiting at the candle’s close is another option. But what if they wanted to short this trend?
Shorting the Hanging Man Pattern
Let’s say our trader decided to enter at the close of the bearish hammer. They buy 10 shares at $168.51 at the open on the following morning, March 30, 2022.
With a total position size of $1685.10, they place a stop at $171.00, above the hammer’s top ($170.83).
At each of the next few closes, the profit on this position grows. The stop above the hanging man is never tested, and our trader can simply wait to see if the market makes any signals to exit the short position. Perhaps they exit on April 13, at the $155.54 close of the bullish engulfing candle.
But if the trade is held longer, we can see that the market continued selling more rapidly in the coming weeks. The massive selloff after this hanging man candlestick had AMZN trading as low as $102.41 in early May.
Final Numbers
If our trader exits early at the first bullish engulfing candle, their profit is $129.70, a 7.7% gain in 15 days.
But if the trade is held longer, they will watch their position grow more rapidly as the downtrend gains momentum. In May, the unrealized profit reaches $661, a 39% gain in just 6 weeks!
Because our trader placed a stop above the hammer, their risk was about $24.90 for a position of 10 shares. Depending on their entry, their risk-to-reward ratio is anywhere from 1:6 (closing at the bullish engulfing) to 1:26.5 (closing near the lows of May).
Conclusion
Hopefully by now, you see the potential that lies in the market for traders who understand their candlesticks. With the hanging man pattern, you will have another tool for situations that may require swift action. But the hanging man is just one of four variations of this shape. Learn about the other three forms of this pattern next:
- Hammer/Morning Star (bullish)
- Inverted Hammer (bullish)
- Gravestone Doji/Shooting Star (bearish)
Leave a Reply