In addition, any charts for financial instruments in this article are for education only. The examples shown here do not constitute trading advice or a solicitation to buy or sell any financial instrument. Past performance is not necessarily an indication of future performance.
If you would like to learn more, please read this Disclaimer for details.
The bullish engulfing is a candlestick pattern that technical traders use as a buy signal. It involves a pair of candles that show a sudden rise in buying pressure. Technical traders use this as a clue to open a long, or close a short, anticipating a bullish run.
What does a bullish engulfing candlestick look like? See the image below. Notice that the second candle’s body completely envelops the smaller body of the first candle. This is why traders use the word “engulfing” with this pattern.
How to Identify a Bullish Engulfing Candlestick
For a pair of candles to qualify as a bullish candlestick pattern, there are a few simple rules to follow. If you stick to these rules, you will soon be able to quickly locate the bullish engulfing pattern in every chart you look at.
1) Compare the body of the two candles.
The first requirement for a correct bullish engulfing pattern is that the first candle is bearish (or a doji), and has a smaller body than the second.
2) Compare the open and close prices of the two candles.
This step has two parts:
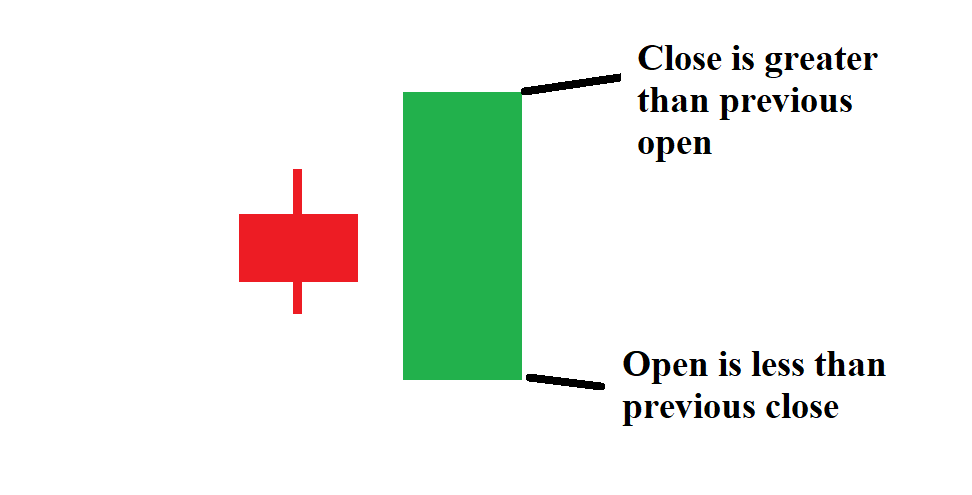
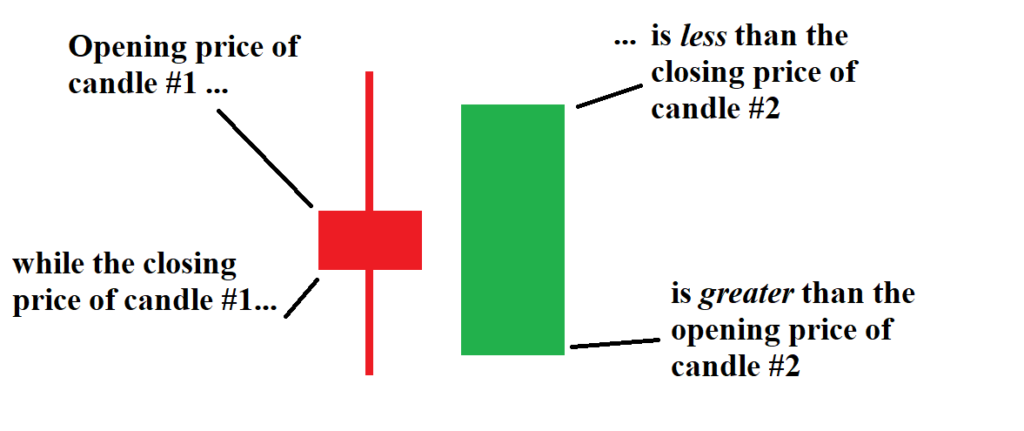
- The second candle’s open must be less than the close of the first candle.
- The second candle’s close must be greater than the open of the first.
What this means is that the price gapped down between the first candle’s close and the second candle’s open. This is the only way for the second candle to successfully open below the first candle’s close and qualify as an engulfing candle.
If it is difficult to tell from looking at it, verify by comparing the actual prices on the candles.
3) Consider the wicks of the two candles.
Some candles have prominent wicks, which technical traders read in various ways.
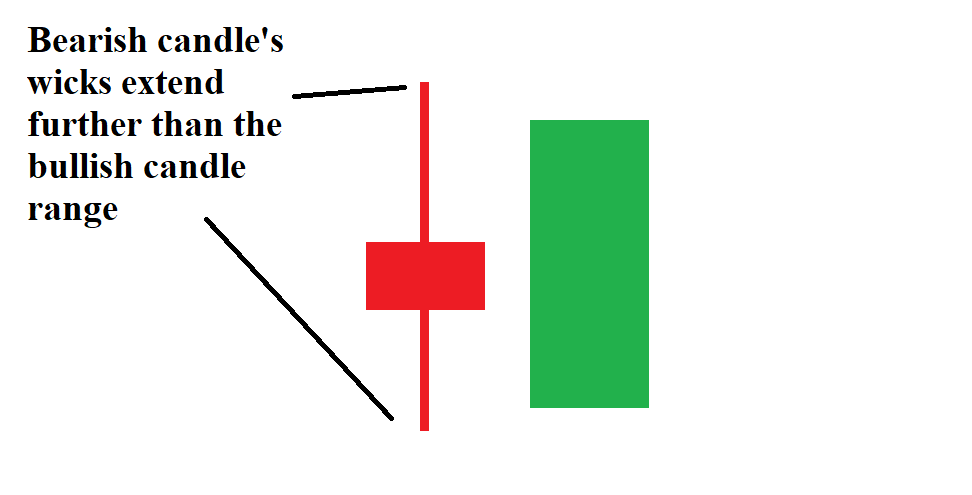
Sometimes the bearish candle will have a large wick, extending beyond the range of the engulfing candle. But the wicks don’t affect the relationship of the two bodies, so this pair below still qualifies as a bullish engulfing pattern.
However, if the wicks of the first candle are also contained by the second candle’s body, it is an even stronger signal. This depicts that the entire previous candle’s movement was undone by the buying that took place during the second candle.
The Psychology Behind the Bullish Engulfing Candlestick Pattern
Recall that for the second candle to open lower than the previous candle’s close, there has to be a gap down in price.
This price gap is essential for a pair of candles to create a bullish engulfing pattern. When the market gaps down during a downtrend, traders judge this as signs of a continued downward move. Then, as price rebounds and the candle turns bullish, traders gauge that buyers took control. The market managed to completely recover the selloff plus the gap down that came after.
This is often a sign that the buyers have entered the market in relatively large numbers, immediately seizing control of the market for a moment. While sellers had been driving price down for some time, the market continued to close lower. Then, when buyers came into the picture, they not only pushed the market back up to erase the previous candle’s losses, but successfully pushed the price even higher than that. When a candle closes bullish after such an immediate reversal, it suggests a new bullish trend can develop.
How to Trade the Bullish Engulfing Candlestick Pattern
If a trader is aiming to enter a bullish trend, this is a great pattern to look for. Once this pattern appears after a downward move, our trader might enter on the close of the bullish engulfing candle, with their stop loss placed below the wicks of the two candles being analyzed.
Example Trade
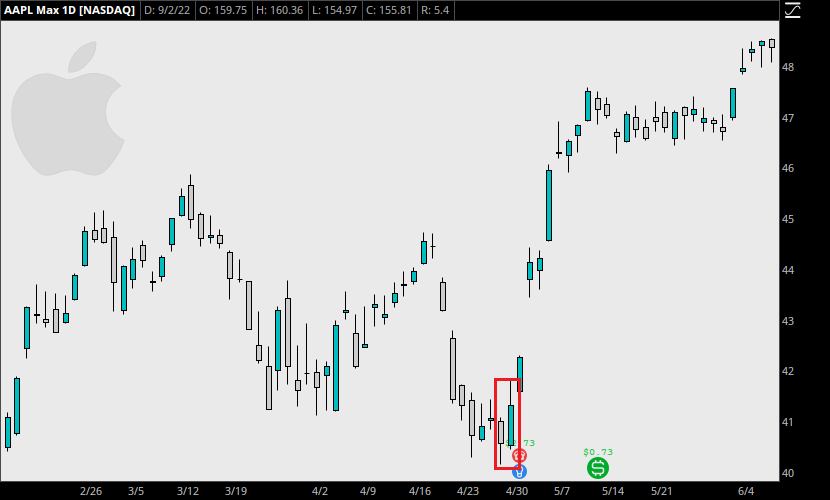
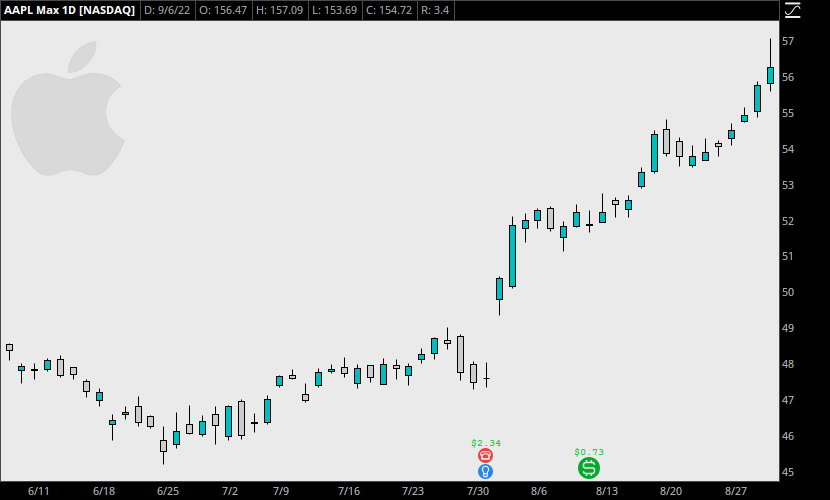
Take a look at the image below of Apple (AAPL), depicting the days from February through May of 2018. The market was trending upward toward $46 in February, and then spent a few weeks pulling back down below $42. After a brief pause, sellers pushed price down rapidly, almost reaching $40 at the lowest point.
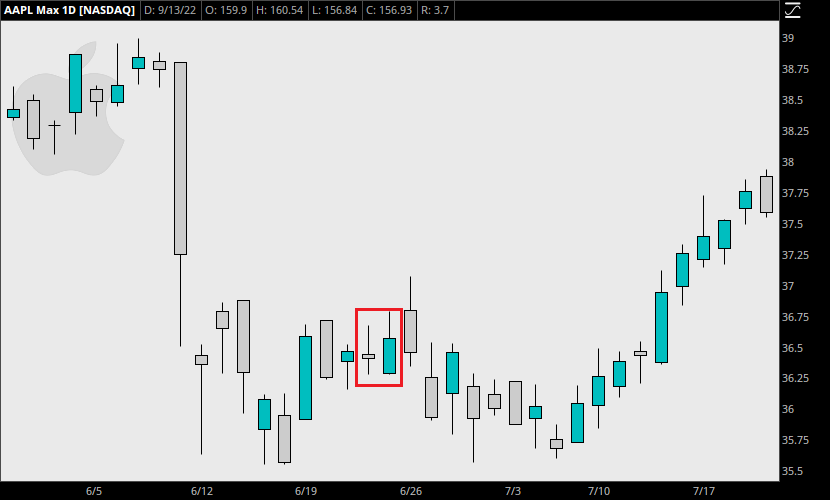
Then, in the red boxed region, a bullish engulfing candle pattern appeared. Price gapped down to create a lower open, rebounded during the day to erase the previous day’s downward price action, and closed higher than the previous day’s open. Immediately afterward, the market shot up from about $41.32 to $48.56 in the next five weeks, a gain of over 17%. Price continued over the longer term, reaching $58.37 before another significant pullback.
How should our trader proceed after this particular setup?
Once the bullish engulfing candle closes, a trader can enter a long position and look for confirmation during the next few candlesticks. This would mean entering at a price of about $41.32. They can place their stop loss below the low of the bearish candle, somewhere around $40.10 or $40.15. This ensures that if the market pushed lower, the maximum risk is about $1.15 or $1.20 per share.
Some traders may elect to use the low of the engulfing candle instead, at $40.46. But note that the first candle had a lower low than the bullish engulfing candle that came after. I consider this to be a more significant level of support.
In addition, if price were to contest the lows of the first candle, it would indicate that there was something missing in the analysis done before taking the bullish engulfing signal.
Entering a trade with the bullish engulfing pattern here provides an entry at about $41.32, for a potential profit of $7.24 or 17%. The maximum risk, assuming a timely entry, is about $1.20 per share. Considering that numerous traders operate on a 1:3 or 1:2 risk-reward ratio, it’s easy to see how more precise trades like this (1:6 risk-reward) can significantly boost one’s performance and returns.
For the Professionals…
An expert trader might judge in advance whether the market will close with a bullish engulfing candlestick. In the same example above, our more experienced trader could open a long position in the final 1-2 hours of the trading day. This entry might be somewhere around $41.15, or even a few cents cheaper.
In addition, take a look at the price action after the market reached $48.50. A more experienced trader may read this and decide to hold his position. The market retraced to $45.22 in June, and then continued up to $58.37 by early October. This longer term trade provided a maximum profit of just over $17, or 41%. With the same stop loss, the risk would have remained roughly $1 (1:17 risk to reward ratio).
When NOT to Trade: Analyzing the Bullish Engulfing Pattern Reliability
Some traders consider raw statistics when determining the reliability of a pattern like a bullish engulfing candlestick. Using historical data, analysts tracked every bullish engulfing pattern in various markets over a number of years. Different analysts have come up with varying figures; some reported that this pattern was effective roughly 50% of the time. Others found as much as a 70% rate of success.
I don’t subscribe to this approach, which I unpacked further in this article. To summarize, gauging a candle pattern’s reliability in a vacuum is seemingly straightforward but actually deceptive.
Ideally, the bullish signal occurs when the two candles’ lows are also the relative low at that point in the pullback. If there isn’t a selloff, or there are several lower lows directly to the left of the engulfing candle pair, the signal is not reliable.
Notice that in this example, the bullish engulfing occurs with lower lows occurring to the immediate left of the pattern.
This signal is weak. Although the market does still eventually begin trending upward, a tight stop loss is not applicable here. The trade would require a wide stop (lower than the lows to the left) or a different entry.
Learn about the bearish engulfing candlestick pattern next.
Leave a Reply