In addition, any charts for financial instruments in this article are for education only. The examples shown here do not constitute trading advice or a solicitation to buy or sell any financial instrument. Past performance is not necessarily an indication of future performance.
If you would like to learn more, please read this Disclaimer for details.
The bearish engulfing is a candlestick pattern that technical traders use to identify an area of weakness. It involves a pair of candles, in which the second candle serves as a signal for technical traders to open a short, or close a long, right before the market begins selling off.
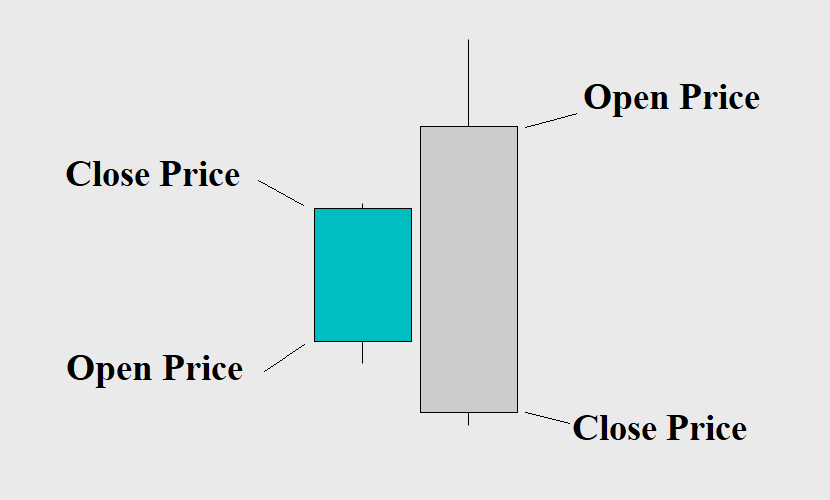
See the image below. The second candle’s body completely envelops the smaller body of the first candle. Traders use the word “engulfing” because of this relationship between the candle bodies.
How to Identify a Bearish Engulfing Candlestick Pattern
For a pair of candles to qualify as a bearish candlestick pattern, there are a few simple rules to follow. If you’ve read the guide on bullish engulfing candles, these rules should be familiar to you.
1) Compare the body of the two candles.
The first requirement for a correct bearish engulfing pattern is that the first candle is bullish (or a doji), and has a smaller body than the second.
2) Compare the open and close prices of the two candles.
This step has two parts:
- The second candle’s open must be greater than the close of the first candle.
- The second candle’s close must be less than the open of the first.
For the second candle to open at a higher price than the first candle’s close, the price must gap up. Otherwise, the second candle would open at the previous close, which means it would not qualify as an engulfing candle.
If it is difficult to tell from looking at it, verify by comparing the actual prices on the candles.
3) Consider the wicks of the two candles.
Sometimes the bullish candle will have a large wick, extending beyond the range of the bearish engulfing candle. But the wicks don’t affect the relationship of the two bodies. The pair below still qualifies as a bearish engulfing pattern.
However, if the wicks of the first candle are also contained by the second candle’s full range, it is a stronger signal. This implies that the entire previous candle’s movement was undone by the selling that took place during the second candle.
The Psychology Behind the Bearish Engulfing Candlestick Pattern
For the second candle to open higher than the previous candle’s close, there has to be a gap up.
This price gap is the key for any candlestick pair to qualify as a bearish engulfing pattern. When the market is trending upwards, and suddenly gaps up, it suggests a continued bullish move. But soon after, the market quickly reverses and sells off heavily, enveloping the previous bullish candle.
This is often a sign that the sellers immediately overwhelmed the buyers for the time being. While buyers pushed the price up, they couldn’t hold it at the higher prices in the second candle. When sellers came into the picture, they not only sold enough to create a bearish candle, but wiped out the entire previous candle’s gains in the process. This decisive reversal in price action signals a continuation of stronger selling in the near future.
How to Trade the Bearish Engulfing Candlestick Pattern
Traders can use a bearish reversal pattern to either open a short position or close their long position. Shorting is typically less practiced by traders, as it often requires additional requirements. Let’s focus on using a bearish engulfing pattern to exit a long position for now.
Example Trade
Take a look at the chart below. When prices approach $350 per share in late November 2021, a bearish engulfing pattern appears at the all-time high of $349.67.
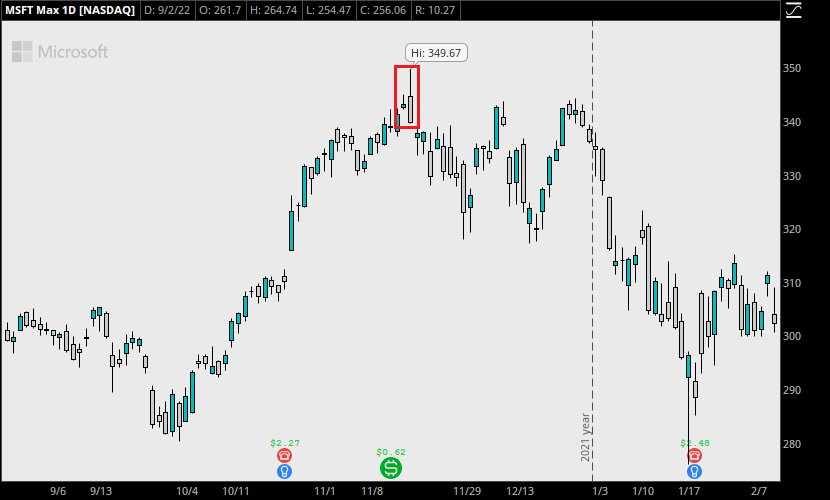
Imagine our trader went long on Microsoft (MSFT) with 10 shares, entered at $275 per share sometime in July 2021. The market is on a steady uptrend, pushing toward the highs by November. At the new high on November 22, 2021, with an initial investment of $2750, this position shows a profit of $746.70, a 27% gain.
The bearish engulfing pattern appears on the same day. It suggests that the bullish trend is showing signs of exhaustion. Not only that, the candle is massive, compared to the previous day.
Upon noticing this formation at the top of an extended upward run, our trader may consider an exit. Rather than risking the unrealized profits, our savvy trader decides to exit the position after the bearish candle.
From this point on, sellers begin to drive price downward. MSFT recovers to $342 a few times, and ultimately collapses. Prices reach as low as $275 per share in the next two months. At the time of writing this article, 8 months afterward, MSFT is trading at $256 per share, a 26.7% drop from the highs. Prices have not managed to break above $300 since April 2022.
Final Numbers
After the bearish engulfing candle closes at $339.83, our trader decides to exit the following day at the open. At the open of $337.05 per share, their position is up $62.05 per share, and they lock in a total profit of $620.50, a 22.6% gain.
If our trader neglected to read the price action, they may have held their position. The unrealized loss is $190 on the original position of 10 shares.
Using this Candlestick Pattern to Short MSFT Instead
While a bearish reversal pattern can signal to exit a long position, experienced day traders often use them to enter a short position as well. In the example above, a trader who is looking to short MSFT might use the same signal. But this time, he will open a new short position rather than close an existing long position.
- Our trader shorts 10 shares just before the close of the bearish engulfing candle, at $340.00, for a position size of $3400.00.
- To curb the infinite risk associated with shorting, they place a stop right above the high. This is coincidentally above the all-time high, at a risk of $98.50, or $9.85 per share. Our trader may opt to instead place their stop at $350.00 if they prefer the round number, for a total risk of $100.00.
- Depending on their profit goals, our trader could take profit at various areas. Some traders may take profit at a break of $300 or hold longer due to the overall market conditions. Others may look to cover anywhere a clear bottom is made, based on price action. At the current price of $256.06, unrealized profits on this imaginary position are $837.70, a risk-to-reward ratio of 1:8.3.
Judging that the market will close with a bearish engulfing candlestick, before the candle closes, pays off here. In this example, the bearish engulfing candle is much larger than the candles before it. Waiting for the candle to close will require a larger stop loss than some traders may be comfortable with. The preceding candle is also a gravestone doji, another powerful signal for traders looking for a bearish move.
Read about the bullish engulfing candlestick pattern here.
Leave a Reply