In addition, any charts for financial instruments in this article are for education only. The examples shown here do not constitute trading advice or a solicitation to buy or sell any financial instrument. Past performance is not necessarily an indication of future performance.
If you would like to learn more, please read this Disclaimer for details.
The hammer candlestick is a single candle pattern in which the shape of the candle resembles a “T”. Its name can vary depending on where the candles appears and small variations in its shape. If it takes place after an extended selloff, traders call it a hammer, or a dragonfly. If the body of the candle is so small that it has the same open and closing price, the term doji can apply.
There are variations of the hammer depending on where it takes place, as well. If it occurs after a bullish move, it is called a hanging man instead.
Traders label a small or no body hammer candlestick with any of the following names: hammer, dragonfly, hammer doji, or dragonfly doji. These are all under the umbrella term, “hammer candlestick”.
In this article, I will explain everything you need to know about the hammer candlestick pattern. Read on to see how traders use this pattern to locate powerful bullish reversals.
How to Identify a Valid Hammer Candlestick Pattern
When the market sells off for an extended period of time, a hammer may form near the lows. This provides crucial insight into potential trend reversals. It is important for traders to understand the implications of such a candle under the right circumstances in the market. But first, a trader must know how to identify this candlestick.
There are multiple ways that traders determine whether a hammer is valid or not. There are also additional factors that traders can use to decide whether to place a trade using this candle. In most cases, traders are looking for two things.
1) The shape of the candle and the size of its wicks.
This pattern is simple because it involves only one candle. But the wicks are crucial in identifying a valid hammer, and increasing the reliability of the trade idea.
- The candle body is small and the lower wick is larger than the body.
- It has a small or no upper wick.
Technical traders often believe that the size of the lower wick should be at least two times the size of the candle body.
But there are times when price is moving in a tight range with lower volatility, creating a small lower wick. As a trader gains experience, their judgment aids this identification process. Rather than seeking a strict 2:1 wick to body ratio, traders can gauge by the appearance of the candles themselves. For example, there may be good hammer candles with a 1.5:1 wick to body ratio. These hammers are often still considered valid based on other contextual clues.
2) Existence of a significant pullback or downtrend.
Regardless of how traders interpret the shape of the candle, the value of this pattern comes from the correct application. When the market is in a downtrend and it produces this candle at relative lows, it is a powerful clue of a change in sentiment. Consider the two charts below.
This first chart is an example of a clear downtrend, with the market trading near recent lows.
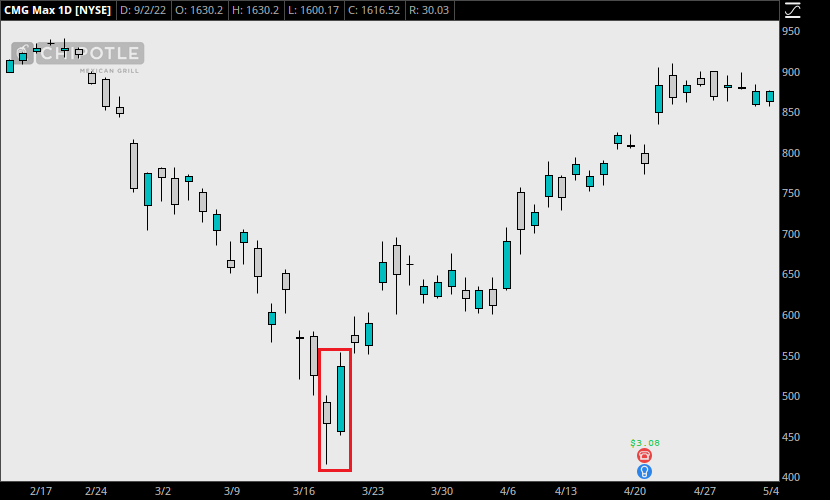
On this chart, however, the price is moving in a sideways range. While the candle is still a hammer in shape, the validity of the hammer as a trade signal is greatly diminished.
The Psychology Behind the Hammer Candlestick Pattern
The appearance of a hammer candle in a downtrend is traditionally a strong sign of a rising bullish sentiment. First, the market began pushing lower, but stopped at some point during the candle. Before the candle closed, price rebounded quickly enough to close either at or near the open price.
Sometimes, the lower wick on the candle is significantly larger than twice the size of the body. Take a look at the hammer in the box below.
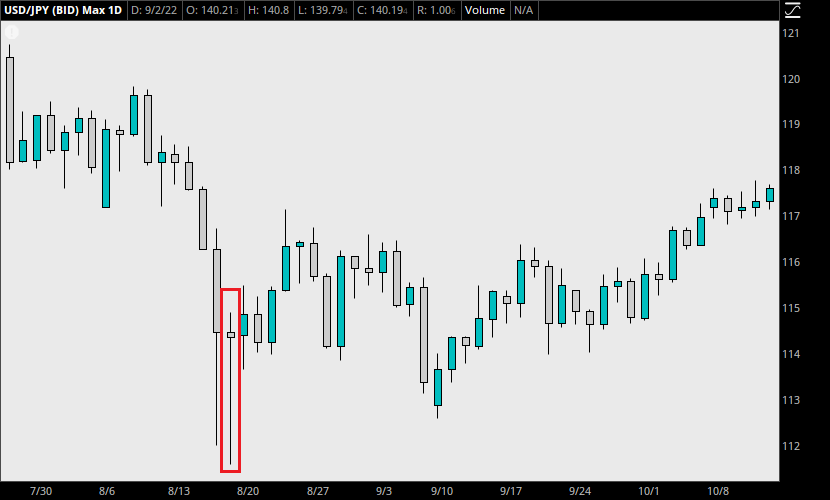
When a hammer has such a large lower wick, it indicates a rapid selloff followed by an incredibly strong reversal, both occurring within a single candle. Buyers took control somewhere along the bottom of the wick, and overpowered the sellers until the candle closed near the highs.
How to Increase the Reliability of a Hammer Candlestick
If the market is in a downtrend and this candlestick pattern appears, it may still not be enough of a reason to take a long position. Experienced traders do more than this to eliminate false reversal signals. Consider the following steps traders take to achieve a higher level of performance.
1) Evaluate whether the candle itself is bullish.
Until now, there hasn’t been any mention of whether a hammer candle is typically bullish or bearish. This is because a bearish candle that has the right hammer shape can still be a powerful bullish signal.
But traders may want to be more selective than using the shape alone. Some traders opt to ignore the hammers that close bearish. They pass up some trades in favor of the candles with a bullish close.
2) Wait for confirmation from the next candle.
Technical traders often choose to wait for confirmation as well. Before deciding to act upon a single candle pattern, traders want to see what the next candle does. They look for a hammer during a downtrend, as well as a bullish close on the subsequent 1-3 candles. While this results in smaller profits due to a later entry, it can increase the reliability of the overall pattern.
3) Combine the hammer with another candlestick pattern.
Another way to improve the quality of a single candle setup is to consider looking for other patterns that develop simultaneously with the hammer candlestick. Perhaps a trader wants the hammer to have the same closing price as its open price, forming a doji. Or they might look for another candlestick pattern that signals a bullish reversal along with the hammer.
For example, in the box below, a hammer candle developed after a significant pullback. But on the next candle, a bullish engulfing pattern forms. This kind of signal is far less common than a simple hammer candle, but provides an additional level of confirmation to enter a bullish trade.
How to Trade Using the Hammer Candlestick Pattern
Knowing that other traders consider the hammer candlestick pattern one of the most powerful bullish reversal signals, it’s a good idea to implement it in a technical strategy. Rather than guessing where a trend may reverse, traders who understand the power of the hammer candlestick can enter trades and place a stop loss using this single candle.
Example Trade
Look at the chart below. After judging that the market is in a downtrend, a trader notices that a bullish hammer develops. A stop loss below the wick offers a low risk entry on a long position.
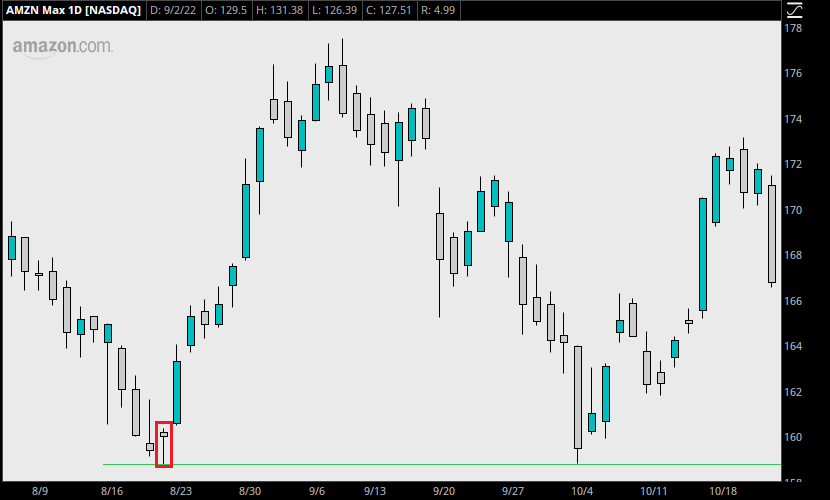
Upon seeing the candle close, our trader enters long with 10 shares at the beginning of the next day. Their entry price is $160.60 per share. Going by the low of the hammer ($158.70), which is lower than the price action around it, the stop loss is placed at $158.00.
The market erupts immediately, running up to over $176 in the next two weeks. Depending on our trader’s profit targets, they may choose to either take profit or hold the position longer. Assuming they take profit somewhere around $175, we can see how this hammer signal produces significant returns in a short period of time.
Final Numbers
On an original investment of $1606.00, profit at $175 per share is $144, a 8.9% gain. With the stop at $158.00, this offers a risk-to-reward ratio of 1:5.5.
Other Implications of the Hammer Candle
Did you notice the horizontal line below the hammer in the chart above? This line depicts support that exists just at the low of the hammer.
Note what happened in October, about 2 months after the original trade was taken. Price came back to test the same level, and the support held. Not long after, the market continued to run, this time reaching over $187.
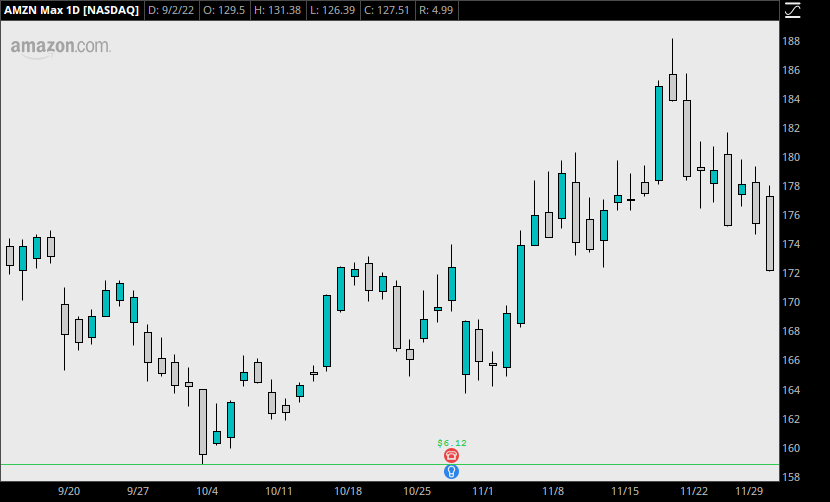
While some traders will take profits during the original run, others may have missed the initial entry. To capitalize on the second run, a trader must be aware of the support level shown in the chart. The hammer forming at that moment helps to tip off that buying pressure exists at those prices.
Once the hammer formed and price began to explode upward, our more experienced trader takes the time to analyze the area around the reversal. By understanding the presence of support, resistance, and even trendlines, they can react to a second pullback appropriately.
Variations of the Hammer Candlestick
Because this candle can form at any time, there are several variations that have their own implications based on the market context. These variations are discussed in separate articles, which you can read about next:
- Inverted Hammer (bullish)
- Hanging Man/Dragon Fly (bearish)
- Gravestone/Shooting Star (bearish)
Leave a Reply