In addition, any charts for financial instruments in this article are for education only. The examples shown here do not constitute trading advice or a solicitation to buy or sell any financial instrument. Past performance is not necessarily an indication of future performance.
If you would like to learn more, please read this Disclaimer for details.
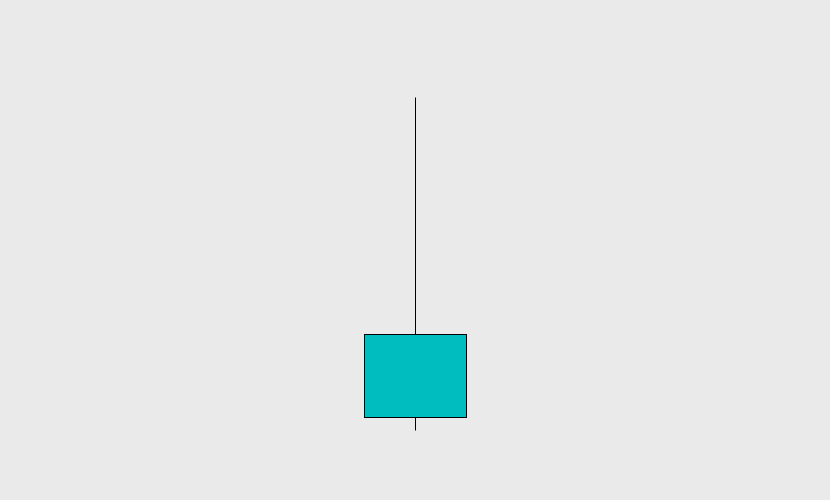
The inverted hammer candlestick is a single candle pattern in which the candle forms an upside-down “T”. If the body of the candle is so small that it has the same open and closing price, the term doji can apply.
Traders refer to this candle with other names, such as reverse hammer, or upside-down hammer.
If this upside-down “T” forms after an extended bullish run, traders call it a gravestone. The gravestone candlestick is another powerful pattern, which I defined here.
In this article, I will explain everything you need to know about the inverted hammer candlestick pattern. I have included examples to show how traders use it as a powerful bullish reversal signal. Let’s get started.
How to Identify a Valid Inverted Hammer Candlestick
If you’re familiar with the hammer candlestick, this part should be easy.
First, a valid inverted hammer forms when the market sells off for some time. Second, it is used as a clue for a bullish reversal after a selloff. The shape is the exact same, but this time the hammer is upside down. Other than this difference, the same criteria can be applied when looking for a valid inverted hammer.
1) The shape of the candle and the size of its wicks.
The wicks are crucial in identifying a valid inverted hammer, and the right kind of wicks increase the reliability of the trade idea.
- The candle body is small and the upper wick is larger than the body.
- It has a small or no lower wick.
As with the hammer candlestick, technical traders often look for a 2:1 wick to body ratio. The wick can be larger, but the body should make up a small portion of the whole candle’s range.
Experienced traders gauge a valid inverted hammer by eyeballing the candles.
2) Existence of a significant pullback or downtrend.
Before making any trading decisions based on any candle, a smart trader will look for the right context. When the market is in a downtrend and it produces this candle at relative lows, it is a powerful clue of a change in sentiment.
If the inverted hammer occurs somewhere other than near the lows of a pullback, it is far less significant. Scalpers may find success trading it in the short term, but traders looking for larger reversals should look for a better signal.
The Psychology Behind the Inverted Hammer Candlestick Pattern
The appearance of an inverted hammer candle in a downtrend is a signal for an increase of buying pressure. While the hammer typically shows an immediate rise in buying pressure due to a reversal occurring within the same candle, an inverted hammer reflects a slightly different phenomenon.
The market opened near the candle’s lows, but buyers pushed price up immediately. Sellers managed to push price back down, but were unable to establish clear control. When the market closes, the price has not moved much relative to the preceding downtrend.
Look at the chart of Chipotle (CMG) stock in the chart below. The market moved down steadily, with sellers in firm control, from mid-October through the first 10 days of November.
Compare the inverted hammer below with the candles that occurred before it. The body is small, with a larger wick to body ratio than the candles surrounding it. The other bearish candles have large bodies and relatively small wicks, comprising the steep drop in those 3 weeks.
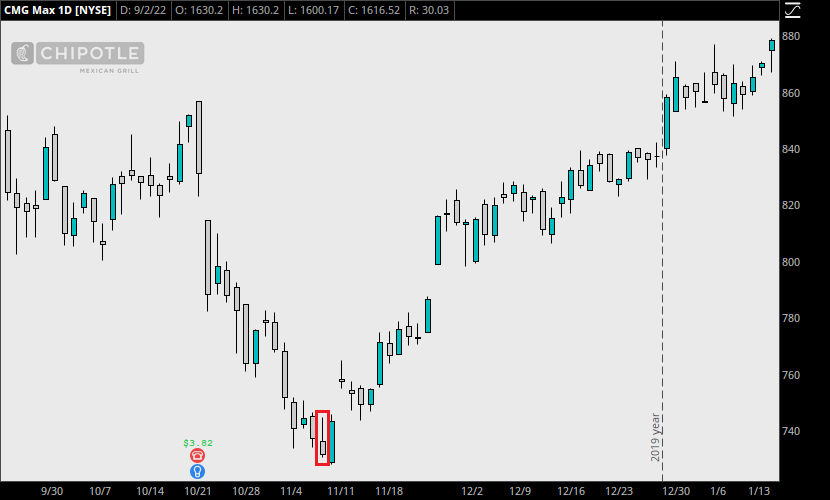
Then, once the inverted hammer formed, the market found its bottom. Buyers were beginning to stop the market from falling any further. During this candle, price rebounded, fell again, but stabilized near the candle’s open price, suggesting that the downtrend had weakened. A bullish engulfing pattern formed immediately afterward as well, for added confirmation.
How to Increase the Reliability of the Inverted Hammer
An inverted hammer sometimes gets followed by another attempt to push the market lower. This is because the price action finished down toward the lows of the candle, signifying that a full reversal has not necessarily begun. The buying pressure that has entered the market is not always firmly in control at the end of the inverted hammer.
In the example above with CMG, the inverted hammer appeared after a downtrend, increasing its reliability as a buy signal. But the following candle opened with a gap down, and eventually closed bullish.
Rushing to enter a trade and placing a tight stop could have caused an immediate stop out on this example. So what can traders do to increase reliability of this candlestick pattern even further?
1) Evaluate whether the candle itself is bullish.
Like the other variations of the hammer, the candle can be either bullish or bearish and still qualify as a valid signal.
But traders who want to be more selective with their inverted hammer signals might decide to consider only the bullish closes.
2) Wait for confirmation from the next candle.
Before deciding to act upon a single candle pattern, some traders wait to see what the next candle does. In the chart above, the inverted hammer spiked upward, and ultimately closed bullish, signaling that buyers were showing increased interest. If traders want extra confirmation, it often comes immediately. The next eight candles closed bullish after this signal.
A trader might look for a single bullish close, or a close above the high of the inverted hammer itself. While this results in smaller profits due to a later entry, it can increase the reliability of the overall pattern.
3) Combine the inverted hammer with another candlestick pattern.
As with other hammer variations, combining the inverted hammer with another bullish candlestick signal is effective at increasing reliability. Some traders prefer the candle to also be a doji. Others may want to see price gap down and recover first.
In S&P 500 Futures (/ES), the market fell dramatically during the first Covid-19 outbreak in the United States. On March 23, 2020, price gapped down, but buyers pushed it back up, forming an inverted hammer, shown in the chart below.
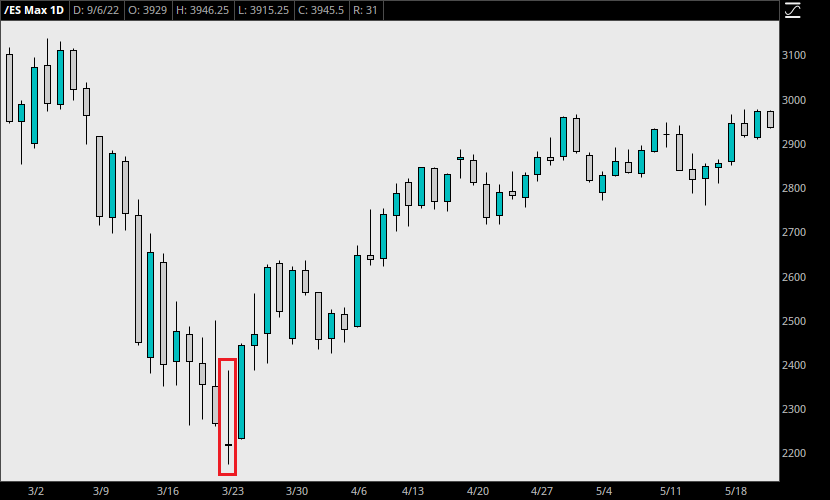
The candle closed just 3 points below the open. From high to low, this single candle moved 212 points, meaning the candle body constituted only 1.4% of this day’s range. Thus, this signal qualifies as a doji as well.
Coupled with the context of the downtrend and bullish close, this inverted hammer shows that the market experienced a significant shift in sentiment during this single day. Technical traders who understand this concept take advantage and open their long positions or close their short positions accordingly.
How to Trade Using the Inverted Hammer Candlestick Pattern
The inverted hammer is effective while looking for powerful bullish reversal signals. Rather than entering a trend haphazardly, traders who implement the inverted hammer in their entry strategy can reduce their risk. But it can still be tricky to play correctly. This pattern, while strong, takes practice to master.
Example Trade
This chart shows how traders can use this signal to enter a bullish trend strategically. See the chart of META below, showing daily candles from March through May of 2021.
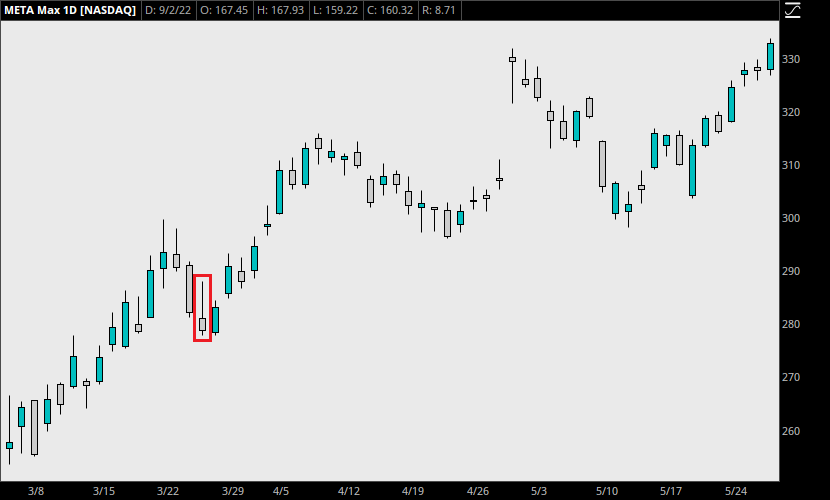
After establishing a clear bullish trend, someone on the sidelines may seek an opportunity to enter the market. Imagine a technical trader is looking to buy 10 shares of META, but doesn’t want to gamble by entering at a random price. When the inverted hammer appears, our trader places a buy order for 10 shares at the close of this candle.
At a closing price of $278.74 per share, the position size is $2787.40. With the inverted hammer’s low at $277.75, a stop loss is placed a bit lower, at $277.00. A wider stop is recommended in some cases, but traders often follow a 1% rule. More experienced traders can judge the type of stop needed by the price action around the entry.
A bullish engulfing pattern shows up on Day 2, providing additional confirmation that this trade idea is solid. With a risk of just $17.40 on 10 shares, our trader sees an unrealized profit of over $500 in just two months. Profit can be taken based on their strategy, but holding this position for 3-4 more months provides even more profit in this case.
Exiting the position in May at $330.00 per share, our trader makes a profit of $512.60, a 18.3% gain on the original position. The risk-reward ratio on this trade is a staggering 1:29.46.
Alternatively, our trader may wait for the confirmation from the bullish engulfing candle. This entry comes in at $285.77 per share, at the open of the candle after the bullish engulfing pattern appears. The profit on this new trade is $442.30, a gain of 15.5% with a risk-reward ratio of 1:5. Having to place a stop below the inverted hammer at $277, this later entry increases the risk, but also provides our trader with extra confidence because of the confirmation candle.
Conclusion
The inverted hammer is a deceptively simple pattern that traders implement to boost their profitability. It can occur at the top of a trend as well, but with other implications. For one, it would be called a gravestone, or gravestone doji depending on the type of body. Learn about the gravestone and other variations of the hammer candlestick pattern next:
- Hammer/Dragon Fly (bullish)
- Hanging Man (bearish)
- Gravestone/Shooting Star (bearish)
Leave a Reply