In addition, any charts for financial instruments in this article are for education only. The examples shown here do not constitute trading advice or a solicitation to buy or sell any financial instrument. Past performance is not necessarily an indication of future performance.
If you would like to learn more, please read this Disclaimer for details.
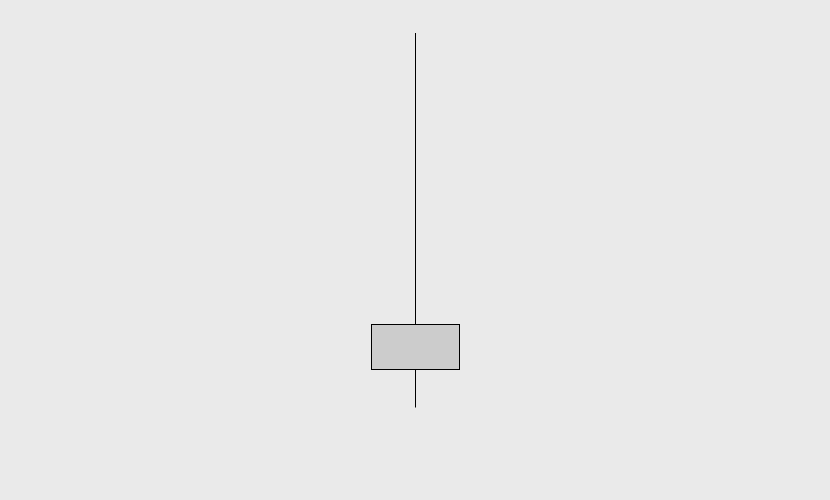
The gravestone doji, or shooting star, is a single candle pattern that resembles the inverted hammer.
Traders may refer to it simply as the “gravestone”, but I will refer to it as gravestone doji throughout this article and others.
If this candle appears after an extended bullish run, it is a powerful signal of a potential bearish reversal.
We will be looking at several examples of the gravestone doji in action here. Technical traders who learn to use this candlestick pattern can dramatically improve their entries and exits. Let’s begin.
How to Identify a Valid Gravestone Doji Candlestick
While its shape is the same as an inverted hammer, the position and implications of this candlestick are the opposite.
A valid gravestone doji forms when the market has been on rising for some time. It is used as a clue for a bearish reversal, due to weakness in buying pressure.
When identifying the gravestone doji by its shape, we check the same criteria used with the inverted hammer.
1) The shape of the candle and the size of its wicks.
Look for the following two signs to see if a candle qualifies:
- The candle body is small and the upper wick is larger than the body.
- It has a small or no lower wick.
Technical traders will look for a 2:1 wick to body ratio, but the larger the wick, the stronger the signal.
As with the other hammer variations, experienced traders can identify a valid gravestone doji by the look of it.
2) Rising price leading up to the gravestone doji.
When the market is in an uptrend and this candle appears at the highs, it is a powerful clue that buyers are struggling to push price further.
If the gravestone doji occurs somewhere other than near the highs of an uptrend, it is far less significant.
The Psychology Behind the Gravestone Doji Candlestick
The arrival of a gravestone doji in an uptrend is a sign of increased selling pressure. Consider what is happening within the candle to form the final shape.
The market opens, and buyers pushed price up. After reaching a certain price, sellers flood the market, driving price back down to the lows of the candle. This creates the larger upper wick. When the candle closes, the price remains toward the lows, roughly the same place it opened.
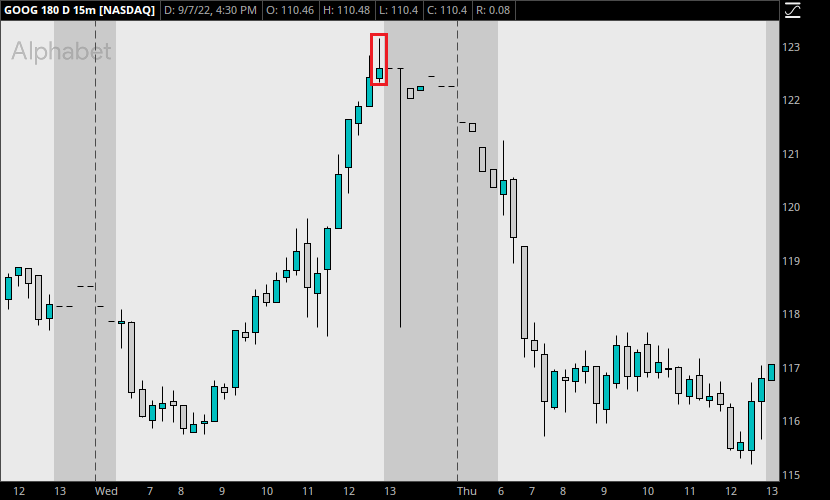
The chart below shows Amazon (AMZN) stock in 2021. For a few months, buyers pushed price up from March to mid-July. Price made an all-time high on July 13, 2021.
Immediately after making a new high at $188.65, the market makes a bearish gravestone doji to end the day. This signaled to traders that the new price is being rejected.
The market rapidly sells off, gapping down over $11 by early August. Price stays below $180 for the next four months.
Traders who understand this psychology can take advantage of it in the right situation.
How to Increase the Reliability of the Gravestone Doji
While it can be a great signal for a bearish reversal, a weaker gravestone doji might only cause the market to pause momentarily. Traders may look to improve its effectiveness as a bearish reversal pattern by combining it with other factors.
In addition during a volatile uptrend, it may feel too risky to enter a short position too early. Consider some of the following options.
1) Evaluate whether the candle itself is bullish.
Like the other types of hammer candlestick patterns, a gravestone doji might be bullish or bearish. A bearish gravestone doji with a long wick is ideal. A gravestone doji that closes bearish after a sharp bullish trend is typically more reliable.
2) Analyze the types of candles occurring around it.
Avoiding bullish closes is one option. An even better option is to consider the types of candles before it. Are they all bullish, with large bodies and no wicks? Or are some showing signs of bearishness leading into the gravestone doji? While more bearish signals can be a bonus, the type of candles matters as well.
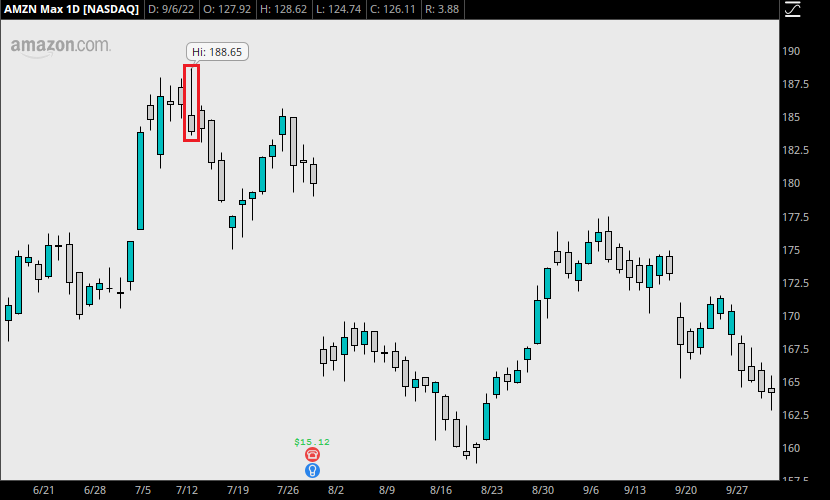
In the following chart of Nvidia (NVDA), numerous candles show constricted ranges and small bodies. Finding a small gravestone doji here is insignificant, because there have been numerous small body candles before it. Traders are not likely to consider this single candle as a valid reason to begin dumping their positions.
Thus, while the small bodies indicate indecision, sellers show no follow through during this period. The market simply continues on its original upward path.
3) Wait for confirmation from the next candle.
As with other patterns, some traders might wait to see the next candle close bearish as well. If a gravestone doji appears, and the market immediately plunges downward, this indicates a clear shift in trader sentiment.
4) Combine the gravestone doji with another candlestick pattern.
As with other single candle patterns, try combining the gravestone doji with another bearish candlestick or other indication of selling pressure. Some traders look for a price gap up leading up to it.
In the example trade below, you will see a gravestone doji that formed the same day that price gapped upward. Once it reached a level that buyers could no longer sustain, the gravestone doji appears and sellers take over.
How to Trade Using the Gravestone Doji Candlestick Pattern
This candle is most effective while looking for a powerful bearish reversal. Sometimes, it can aid in exiting a long position at a convenient time, too. The market might have reached too high of a price in one trading session, leaving buyers exhausted at the new levels. When a gravestone doji forms, smart technical traders make a note of it and consider closing their long positions rather than leaving it up to chance.
Example Trade
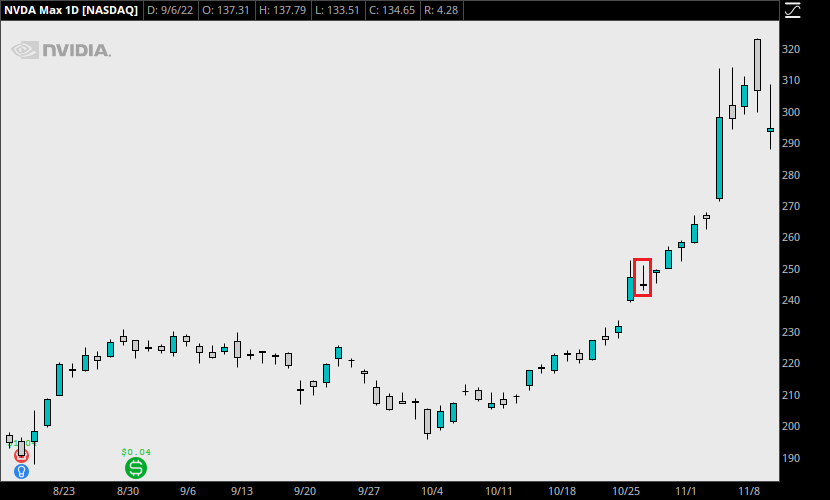
Take a look at the following chart of Alphabet (GOOG), depicting 1-Hour candles from May 12-20, 2022.
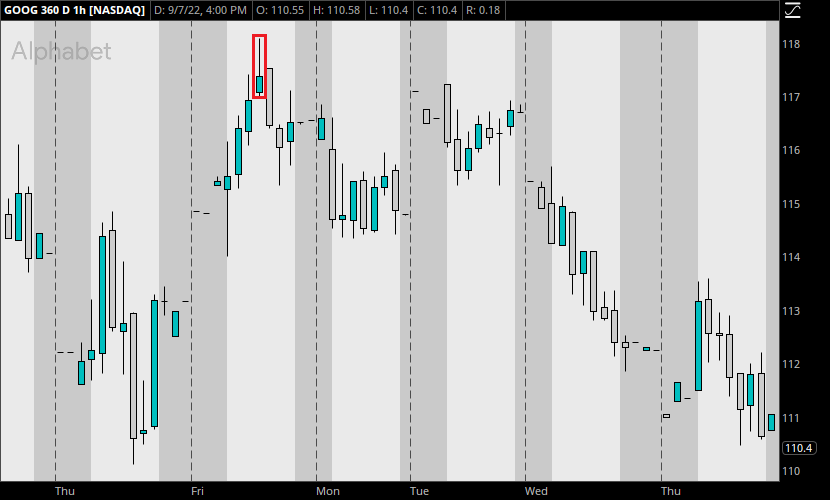
GOOG ran from $111 to $118 per share over two days. While we have a separate article for the candlestick pattern that started the trend, let’s focus on the way Friday finished.
After an extended run intraday, the market began to exhaust above $117. A gravestone doji formed on the 1-Hour chart, showing a larger upper wick than the candles before it. In addition, the market had gapped up significantly this morning.
A trader who understood that a bullish trend was underway might have entered the market anywhere from $111 to $113 the previous day. Let’s say our trader bought 20 shares at $111 per share at 9:45 AM.
With a total position size of $2220, they place a stop below Thursday morning low ($110.11), at an even $110.00.
Once the market takes off, our trader is in the profit for about $100 the following day. They consider whether it’s wise to hold the position longer. After all, the market has been trending well! But on Friday morning, at 9:00 AM, the 1-Hour candle closes with a gravestone doji.
Price begins to drop as the candle closes, and the large upper wick screams at our trader to take notice. Since our trader reads this blog, they understand the significance of the candle, and decide to exit the trade at the close of $117.37. Alternatively, they may wait for confirmation, which comes the following hour in the form of a bearish engulfing. Waiting for this second candle to close costs our trader an extra $0.95, or $19 of their profit.
Final Numbers
The total profit is $127.40, a 5.7% gain in about one day. With a stop at $110.00, they achieved a risk-reward ratio of 1:6.3.
With the confirmation candle, the profit is $108.40, a 4.9% gain with a risk-reward ratio of 1:5.4.
If traders ignore the signal and wait for the next day, their position suffers immediately. The market touches $114.52 in the first hour, cutting profits nearly in half. By Friday of the same week, GOOG is trading as low as $106.42, and falls to $102.21 the following Tuesday. After the gravestone doji, GOOG stock fell about 12.5% in less than 7 trading days.
Shorting the Gravestone Doji
Of course, traders who are looking for a short position can play the same setup on the opposite side. A trader might notice the signal and enter short immediately before the market close, or after the bearish confirmation candle. This sign of faltering buying pressure proved to be quite significant after a bullish run.
Conclusion
Understanding these candlestick patterns is beneficial, but the gravestone doji is a must-have in every technical trader’s arsenal. Learn about the other variations of the hammer candlestick pattern next:
- Hammer/Dragon Fly (bullish)
- Inverted Hammer (bullish)
- Hanging Man (bearish)
Leave a Reply