In addition, any charts for financial instruments in this article are for education only. The examples shown here do not constitute trading advice or a solicitation to buy or sell any financial instrument. Past performance is not necessarily an indication of future performance.
If you would like to learn more, please read this Disclaimer for details.
Are you a technical trader who’s learning about the proper application of support and resistance? Perhaps you aren’t quite convinced about the efficacy of these lines. In this article, I’m going to show you just how powerful support and resistance are, using examples from the stock market with tickers that should sound familiar.
If you are completely new to using support and resistance, be sure to check this article first. As you’ll see shortly, these concepts can work in any market with sufficient activity. And once you are using them, you’ll wonder how you ever went without them.
In the stock market, some traders worry about manipulation, big pre-market or post-market moves, gaps due to earnings, economic news, and more. Without a proper strategy, the risk of trading is only increased substantially. Support and resistance can provide a sense of structure, even during a period of instability.
By using these concepts correctly, you can improve your trading decisions. Hopefully, by the end of this article, you will have a better idea of what to do in your next trade. Let’s take a look at a few times the stock market showed us just how powerful support and resistance really are.
Amazon (AMZN) Stock: Support and Resistance Set up Multiple Trades
For our first support and resistance example, let’s take a look at Amazon stock.
During the recent recession of 2022-2023, most of the stock market underwent a pretty steep correction. Along with just about every major ticker in the tech sector, Amazon’s stock plummeted. Prices fell from highs of $188.65 ($3773 pre-split) to $81 ($1620 pre-split) per share.
An astute technical trader would have been aware of several significant levels before the recession began. I’ve drawn some of them below. First, there’s resistance that was formed around $102 ($2040 pre-split) in mid-2018. This level is drawn in purple.
When the market rejected this price and came back down, it took almost 2 years to get back up and through it. This happened in early 2020. In those 2 years, price returned once to those levels, in the middle of 2019. On the chart below, locate the bearish gravestone doji that formed at that point.
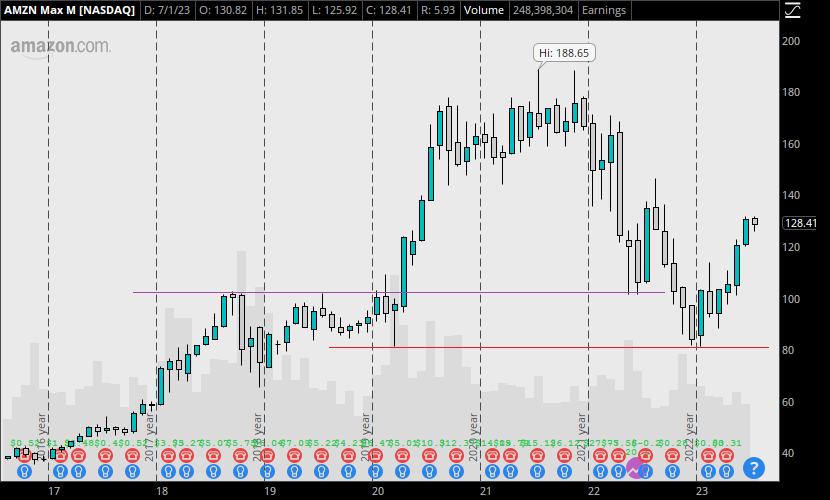
One of the key levels to watch during any major trend is the support and/or resistance that was established before the trend began. It may not be obvious immediately, but the more times you see it, the easier it is to recognize. This level is drawn in red.
Note that before the market took off in 2020, sellers pushed the price down in March. Once the market hit this major support level (the red line), it rebounded and formed the bullish hammer. If you’re always checking for major support and resistance levels in the stock market, you should draw this kind of a line upon the close of that hammer.
As soon as the market begins to move quickly, you have confirmation that the tested level is significant. If there was no real activity, you’d continue to wait, unless your trade requirements were already met. See the size of the bullish candles that came immediately afterward.
How Amazon Tested These Levels
After breaking the lows of the previous 12 months, this March 2020 candle closed as a bullish hammer and bullish harami at the same time. The bullish trend resumed with urgency (shocking after that kind of a candle, right?). From this point, the market ran up to all-time highs over the next year and a half.
Once the recession was underway, however, we can see prices dropped sharply to more familiar levels.
First, it reached the resistance from 2018 (the purple line). As the price approaches prior resistance from above, it’s common to see these levels turn into support. Take a look at the chart to see the results. The market rebounded sharply, from $102 to over $140 in the next 3 months.
But the recession wasn’t over. As price fell off again, see how the market returns to test the major support level exposed by the bullish hammer. This level denoted by the red line at $81 held almost flawlessly. Buyers put an end to the pullback almost instantly, and price rebounded, taking Amazon back to current prices of about $128 per share.
Alphabet (GOOG) Stock: Resistance at the Highs
Google, now called Alphabet, made a run for the all-time highs just before the recession arrived. Sometime in late 2021, prices rocketed from $134 to $152 ($2680 to $3040 pre-split) in 6 weeks. However, a bearish harami close on the monthly chart at this new high showed significant weakness in this run.
As the market came back down in the next few months, another push came in February of 2022. Look at the strength of the bullish trend on the monthly chart below. This run took prices from $90 ($1800 pre-split) to a new all-time high in 2021.
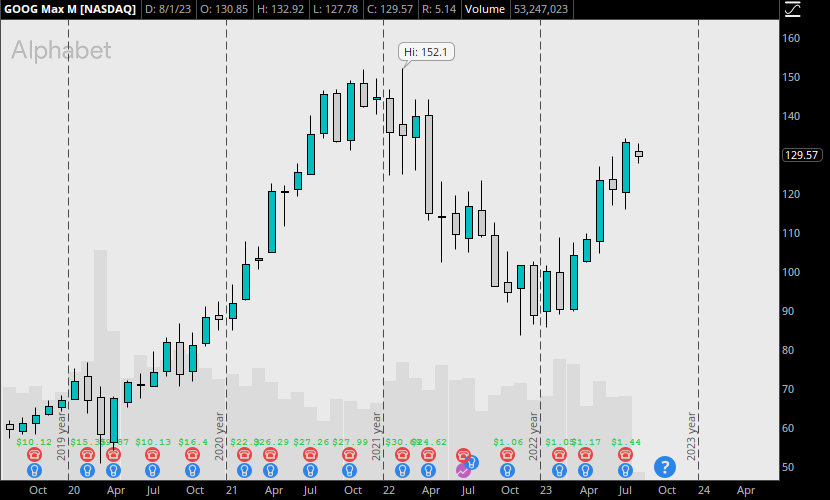
To recognize the bearish harami on the monthly chart at the previous high was the first step. To think about what it meant, however, is the more important step. It’s not enough to understand that the market rejected the new price. Consider what would have happened if you drew a resistance line at this new high. This red line below marks the price level at $152 ($3040 pre-split).
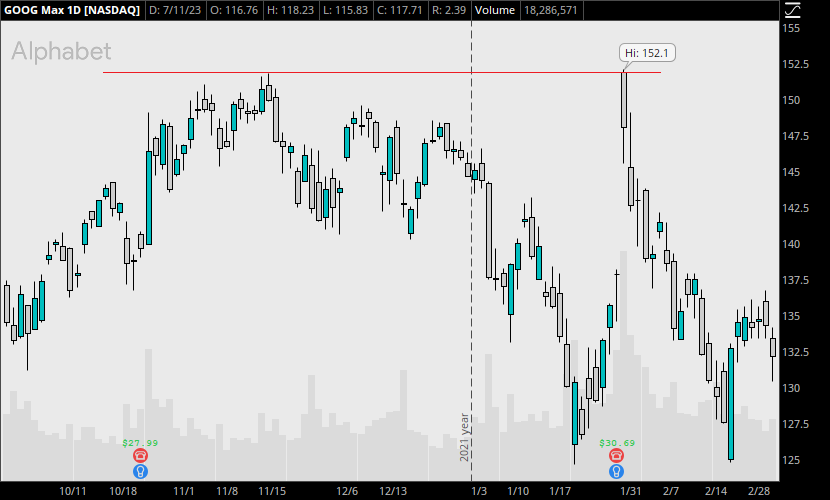
A trader who recognizes that the new high was previously rejected on the monthly chart might notice that price stopped immediately upon reaching this price again. Then, they might decide to open a short position here. Once the market closed at $152.1, it opened the next day 4.6% lower than the previous close, at about $145. Over the course of that morning, it continued lower.
It was easy to see by this point that sellers had serious control at the all-time highs. Shorting here almost makes too much sense. Why overcomplicate it? Trading can feel this simple, if you stay prepared.
For a bonus exercise, spot the strongest support level in the chart of GOOG above. Try to understand why that level was so significant, and what signs indicated that it had such a significance before it was tested again.
Bank of America (BAC) Stock: Support Becomes Resistance and Vice Versa
Bank of America is not a stock that I hear about much lately, but there’s still quite a lot of people trading it. In this example, we’re going to take a look at the quarterly chart. This means every 4 candles is a year, so we’ll be going way back to the early 2000s.
With the time frame being so large, I’d say this is the least exciting example on the list. However, there’s still a lot you can learn here.
The main idea to try to get from the chart below is that a major level can persist for longer than you’d think. The secondary idea pertains to support becoming resistance, and vice versa. This chart provides an excellent example of both.
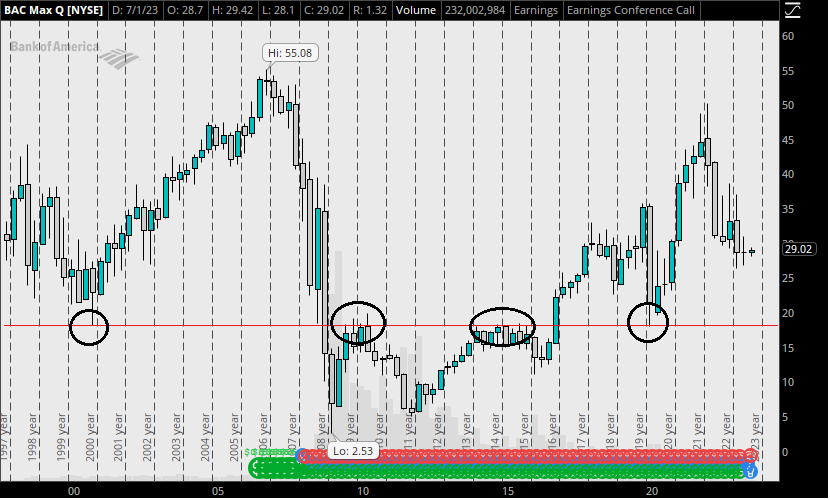
A lot of short-term traders witness support and resistance lines breaking after a few days or weeks or even months. But what about years, or decades? Bank of America’s stock shows us that this is a very real phenomenon, as this same support line has affected the market from 1999 to 2018.
When price first rebounded from the support line, it ran from $20 per share to over $55 over the next 10 years. Then, when the recession caused the bank to nearly fail, it crossed the support line to the downside, turning it into resistance. After it began to recover, it spent another 7 years, unable to cross this major resistance level at $18.
Once price finally did break above $18, notice that it produced a massive bullish candle, and continued rising until about $35. If you stayed ready at this point, with the understanding that previous resistance became support, a trade opportunity arrived in early 2019. Once price tested the $18 level again, it rebounded sharply and blew through previous highs. An entry at $18-20 would have produced profits of over 250% in the next 3 years. Not bad, right?
Tesla (TSLA) Stock: The Trade of a Lifetime
Tesla’s example is by far my favorite. It was a slow-paced development, but the results were extraordinary.
Tesla is interesting for its own reasons, too. Elon Musk is quite polarizing, and is constantly drawing attention in social media. His electric car company was known for having a massive number of short positions against it before 2020. Quite a lot of people were invested in seeing him fail for both personal reasons and business. It seems there’s still a lot of money that doesn’t want electric cars to replace fuel-based vehicles.
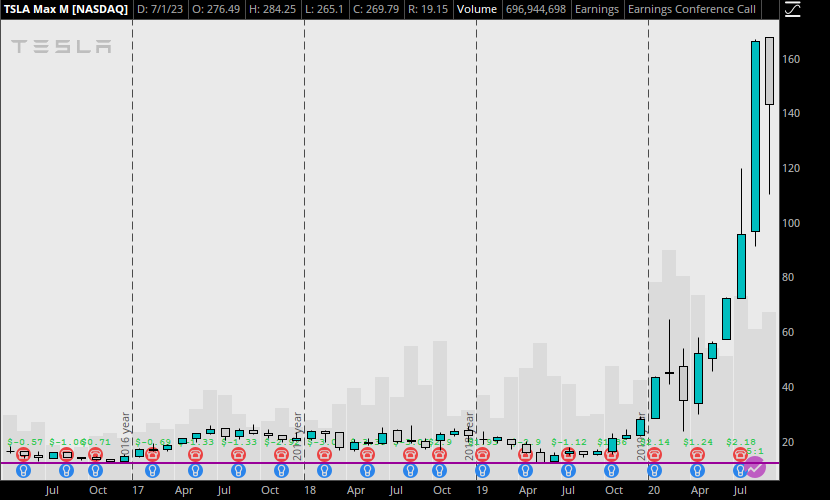
But for better or worse, the failure of TSLA and Elon Musk was not written in the technicals. If you see the chart below, you will notice that just like in the Amazon example, there was an interesting support level established before the trend. The purple line represents the support level, with the two main points circled.
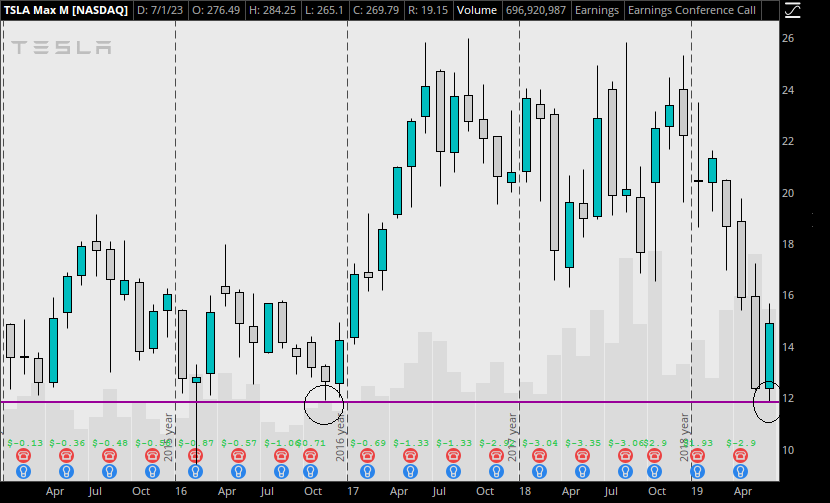
During the time between these two tests of support, TSLA stock meandered back and forth between $16 and $26 ($240 to $390 pre-split) per share.
There were signs on various momentum indicators, notably MACD (my personal favorite), that there was an increase in buying pressure during the end of the downward move. Once the stock reached the major support from 2017…well, if you follow the markets, you already know what happened. TSLA stock shot up from $12 to over $400 ($180 to $6000 pre-split) per share in just 2 years.
Stay Ready
Just like with Amazon, the key here was to look for support and resistance levels. They weren’t hard to find, and anyone could have found this major support level by glancing at the monthly chart. The hard part is checking on a stock actively even when it’s consolidating for months. If you don’t put in the work, you will miss the boat.
Judging by some of the stories of traders who made millions from options or TSLA stock during those years, it’s safe to say at least a few people were ready for it. Let’s all stay ready when we find the next one.
Conclusion
Hopefully these examples helped show why support and resistance are an integral concept in technical analysis. The reasons for why a specific level works so well are actually arbitrary, as long as you can recognize them correctly. The answers are always in the chart, if you know where to look.
But it’s not something that will come easily the first few times. To complicate things, there are varying levels of support and resistance, along with sloping support and resistance in the form of trendlines and channels. The best way to get better at this is to practice. With so many stocks to choose from, you should have no shortage of opportunities to do so.
Something to keep in mind is that not every stock will feature such clear levels all the time. You should develop the habit of checking multiple time frames. If you still cannot spot them, move on. There are enough markets to trade; the one that doesn’t jump out at you might just not have a clear direction yet.
In addition, pairing support and resistance with a second indicator will significantly improve the chances of success. Consider a momentum indicator like RSI or MACD, and find where these indicators provided confirmation as prices tested a support and resistance level. This may come in the form of the indicator showing overbought, oversold, or divergent at a new high or new low. When you see it, make sure you take a moment to understand the implications.
Be creative, and try it out enough to develop a feel for it. In time, you’ll be able to spot support and resistance at first glance. Good luck!
Leave a Reply