In addition, any charts for financial instruments in this article are for education only. The examples shown here do not constitute trading advice or a solicitation to buy or sell any financial instrument. Past performance is not necessarily an indication of future performance.
If you would like to learn more, please read this Disclaimer for details.
Support and Resistance are the most well-known and most popular tools in technical analysis. These terms refer to levels (or prices) where market participants have shown an extraordinary amount of interest. By understanding that buyers or sellers are much more interested in a certain price, it gives technical traders a massive advantage when it’s time to make a trading decision.
Supply and demand are the cause of every shift in price. When demand rises beyond what supply can handle, prices tend to go up. When supply starts accumulating too much relative to the demand, prices tend to fall.
These shifts in price, over time, reflect levels on the chart where buyers or sellers have typically preferred to make decisions or adjust their positions.
Every competent technical trader uses support and resistance in some way. There are technical indicators that attempt to generate significant price levels based on support and resistance concepts. Even trendlines, which are bound to a rising or falling slope on a chart, show the power of support and resistance.
In this article, you’re going to learn all about support and resistance. Once you begin to identify these levels consistently, you can develop more powerful strategies for your entries and exits.
A Brief History of Support and Resistance
A couple noteworthy names come up when you look into potential origins of support and resistance. One is Charles H. Dow, the founder of Dow Jones & Company and the co-founder of The Wall Street Journal. Considered one of the pioneers of technical analysis, Dow did most of his work in the late 1800s.
His work laid the foundation for the Dow Theory, which served as a precursor to the development of modern technical analysis techniques, including support and resistance.
Richard W. Schabacker, another influential figure, published a book titled “Technical Analysis and Stock Market Profits” in 1932. In this book, Schabacker explained identifying support and resistance regions, as well as numerous other technical analysis concepts.
Today, over 90 years later, traders continue to find success applying these tools. Let’s take a look at what these terms really mean.
What is Support and Resistance, Exactly?
As mentioned in the introduction, supply and demand dictate the movement of price in every market. Prices might seem to go up and down at random, but this is not truly what goes on in markets.
What tends to happen over time is that buyers and sellers enter or exit the market at certain prices more often than others. At a price where enough buyers are waiting to enter, price will rebound and go back up. At a price where sellers are ready to dump all of their positions or go short, price will run out of steam and begin to fall.
Support and resistance are the price levels at which buying and selling pressures tend to reverse. Support refers to the level at which the price of an asset is expected to stop falling, as buying pressure overcomes selling pressure. Resistance, on the other hand, represents the level at which the price is expected to stop rising, as selling pressure exceeds buying pressure.
These levels can be visualized on a price chart, providing traders with a roadmap of potential turning points in the market.
Identifying Support and Resistance
While support and resistance typically refer to specific prices (horizontal lines on the chart), there are other forms as well. Depending on the price action you’re looking at, or indicators you’re using, you might identify significant levels in different ways. Let’s take a look at each.
Horizontal S&R
These levels are formed when the price touches the same price level multiple times, creating a horizontal line. To do this, consider the following chart. Whenever the market has significant reversals taking place at a certain price in two different places, it’s worth a closer look.
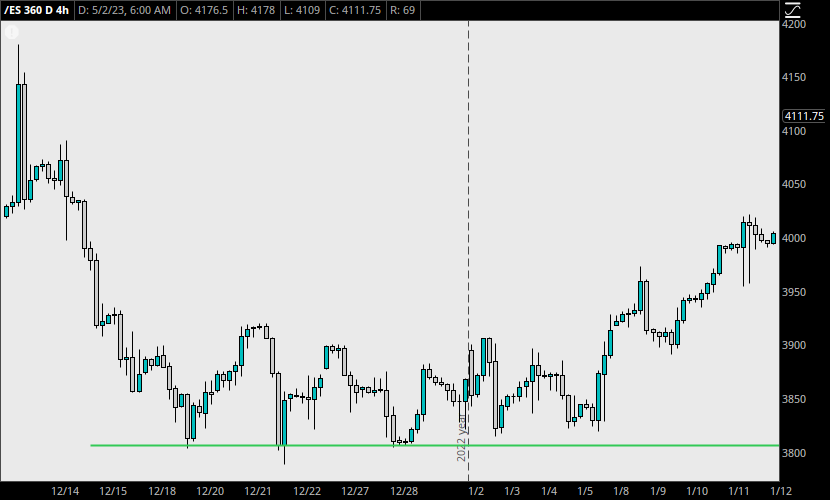
Ask yourself a few questions here. Does the market stop abruptly at this price? Did a trend start in the opposite direction? Was there high volume or low volume at this region, relative to the current time frame we’re in?
You can find examples of horizontal support and resistance everywhere, in all markets and on all time frames.
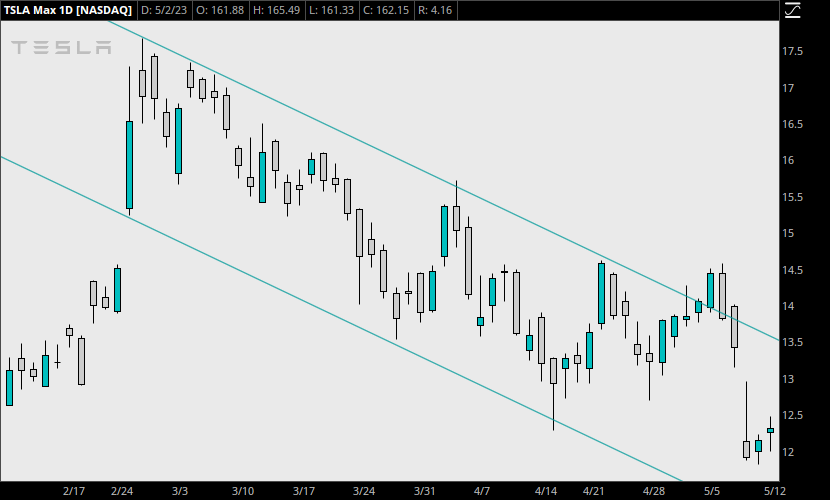
Trendlines, or Diagonal S&R
Trendlines are sloping lines formed by connecting higher highs or lower lows. If the trendline is connected with lows, it can serve as a support level for a future test of this line. A trendline above the price, using the highs, becomes resistance.
Sometimes, price will even move in between two parallel trendlines, which are called a channel. Channels, when identified correctly, are some of the most powerful tools in technical analysis, and are entirely based on the concepts of support and resistance.
This chart shows a price channel which offered numerous support and resistance levels for a perceptive trader.
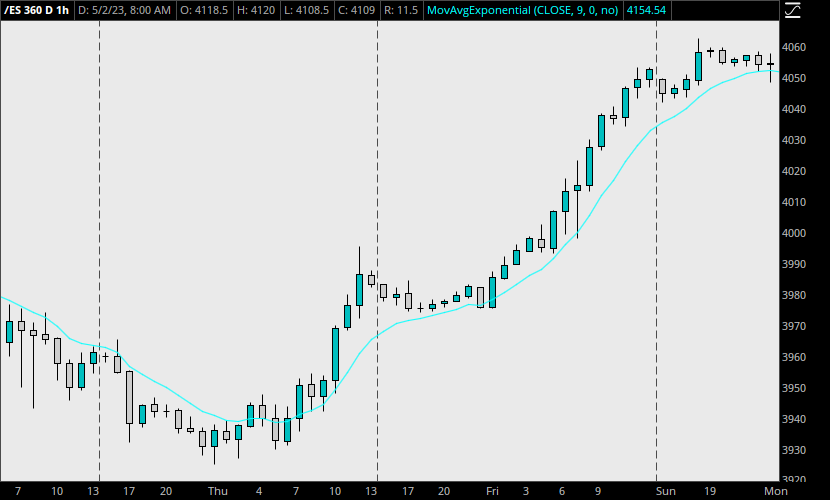
Dynamic S&R
These levels are created by using moving averages or other technical indicators, adjusting dynamically as the price changes.
For example, consider the Ichimoku Cloud indicator, where traders use the edges of the cloud itself. As price approaches the cloud, traders might enter or exit a position depending on if the edge of the cloud is breached.
On the other hand, moving averages that follow price closely or loosely, depending on the period, can serve as significant support and resistance indicators as well. See the following chart for an example of the EMA serving as resistance initially during the downtrend, and then shifting to support as price reverses.
Fibonacci Retracement Levels
If you are a fan of Fibonacci, you might find success using these as support and resistance levels. I will put together a separate article on Fibonacci at some point, so don’t worry if you’re unfamiliar with these.
Support and Resistance Psychology
Since market participants are humans (or trading algorithms made by humans), it’s important to acknowledge that psychology is a factor.
Fear and greed drive traders to buy and sell at higher highs and lower lows, often creating patterns that can be identified as support and resistance.
Market memory also plays a role, as traders remember past price levels where buying or selling pressure was significant. Just as we identify these regions on our charts, drawing lines and keeping them present until they are relevant, millions of traders are eyeing similar levels.
Any good technical trader that sees these levels is sure to take them into consideration, especially if a level is strong enough to produce several successful trades in a row.
The Role of Volume
Volume plays a crucial role in confirming the strength of support and resistance levels. Think about a support level established during a dead market, compared to a level that holds during active hours. With an ocean of orders coming in, if a level continues to hold, it’s much more relevant.
On the other hand, there’s moments where price approaches a level with higher than usual volume. Traders can use this knowledge to infer that this kind of price action may not be legitimate. Sometimes, institutional orders are placed just before a significant level, hoping to push price toward it, and then reverse off of it in the direction that was actually desired.
This often occurs during news releases or other volatile moments in markets. You can find examples of this during just about every major news release. The key is to understand where the levels are, because once the release is out, you might have no time to react.
Support and Resistance Changes with Timeframes
Something you may be wondering is how to apply these concepts to different time frames. What good is a support level from 6 weeks ago, if you’re looking to day trade ES futures?
First off, you can find support and resistance in any time frame. But you must stay aware of what time frame you locate the level on, and apply it accordingly.
A weekly support level might hold for months, while an hourly level might last for a week or two. You can’t expect a support level on the hourly chart to heavily influence a strong weekly trend. If you are positioning your buy order off of a short-term time frame, and enter against a larger, stronger trend, your trade will most likely fail.
Thus, it’s essential to analyze multiple timeframes when determining these levels. Draw the higher time frame levels and channels, and then draw the lower time frame levels afterward. This way, you are always aware of the big and small picture, and don’t lose sight of either.
False Breakouts and Breakdowns
False breakouts and breakdowns occur when the price briefly breaches a support or resistance level but quickly reverses direction. Traders can minimize the impact of false breakouts by waiting for confirmation, such as a candlestick close above or below the level, or by using additional technical indicators.
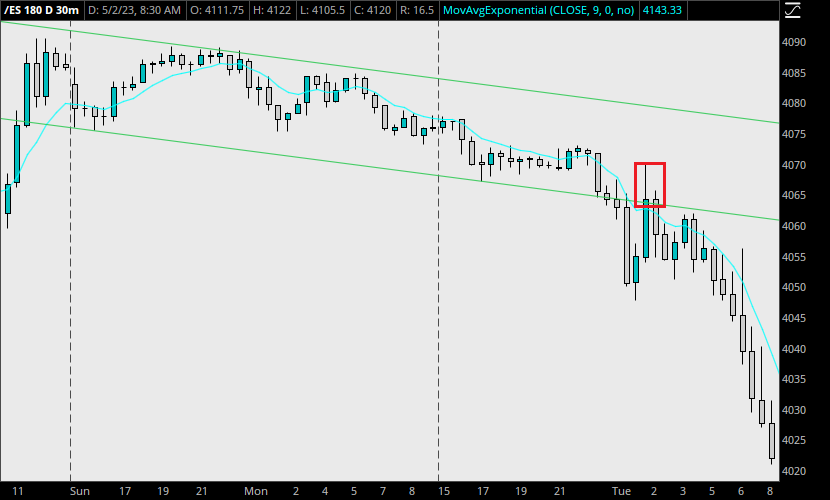
At the risk of making things even more complicated, I will add that support and resistance also flip their roles during successful breakouts. This takes much practice to identify consistently, but it’s worth mentioning here nonetheless. You’ll find this behavior most often during the first successful breakout of a longer term channel.
You can see this take place in the chart below. When the ES broke down out of the channel, it first pulled back, and the support (bottom line) became resistance for the downtrend.
Conclusion
No matter what market you explore, supply and demand are at the foundation of price action. As traders respond to these things, their intentions begin to show up on the chart, allowing us to take advantage of these significant levels in the form of support and resistance.
Use this idea to determine exactly where price has strengths and weaknesses on the chart. Then, using your other indicator(s) or further market analysis, identify where you’d like to trade and where you’d have the most success.
If you’re interested in some examples purely for Forex, feel free to check this article next.
Leave a Reply