In addition, any charts for financial instruments in this article are for education only. The examples shown here do not constitute trading advice or a solicitation to buy or sell any financial instrument. Past performance is not necessarily an indication of future performance.
If you would like to learn more, please read this Disclaimer for details.
When it comes to technical trading in forex, support and resistance are among the most common terms you will hear. I would place support and resistance at the top, along with candlestick analysis, as some of the most powerful tools a technical trader has in their arsenal when tackling the forex markets.
If you are currently trading without these tools in your arsenal, you are limiting the potential of your own trades. By using support and resistance well, a good forex trader can introduce a higher level of accuracy in their trades.
Before we get started, let’s recap what support and resistance mean when it comes to forex.
What are support and resistance in forex trading?
Support and resistance are terms that refer to the upper or lower limits in a market, imposed by supply and demand at these levels. Buying pressure tends to accumulate whenever there are a lot of buyers at one price. When the market pulls back down to this price, there are so many buyers ready to enter a new trade (or add on to their current trade), that the price rapidly recovers from this point.
As this happens again and again, more technical traders become buyers at this price and this often makes the support level even stronger. Markets can continue moving off of these levels for years, as long as the buyers manage to hold the line. This lower level is called support.
The same thing can happen to the upside, with sellers pushing price down at a certain point. As buyers repeatedly push price higher, sellers can accumulate at a specific price level and overpower any upward pushes that reach that level, pulling price back down, often immediately. This upper level is called resistance.
You can read more about support and resistance in depth here. When you’re ready, let’s look at some examples.
A Simple Example of Support vs. Resistance in AUD/JPY
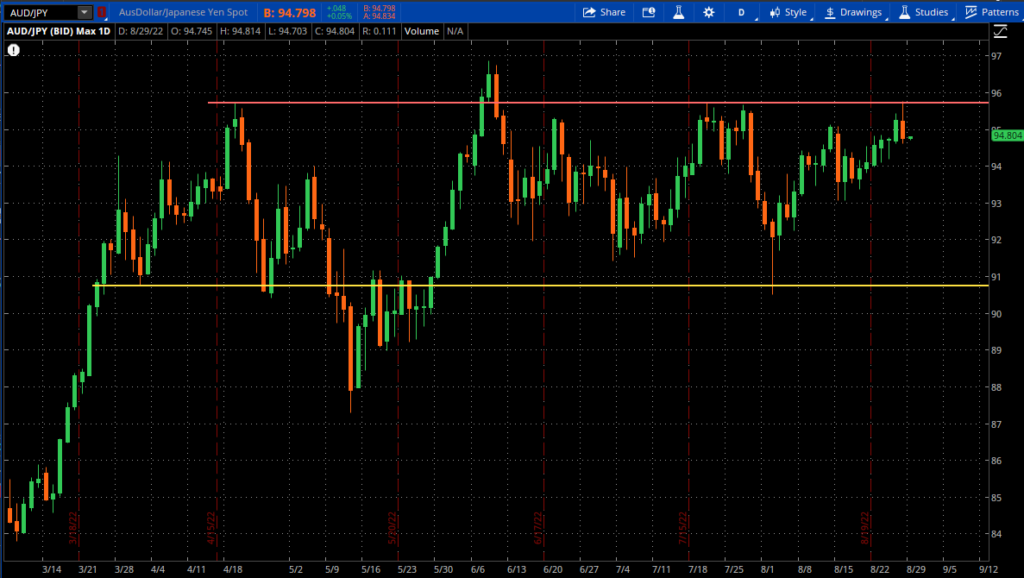
In the image above, I’ve drawn some relevant support (yellow) and resistance (red) on the AUD/JPY Daily chart. There was a strong support level established around May, that was tested again recently in August. As soon as price hit this level, the market rebounded rapidly back upward toward the resistance.
The resistance level on the other hand was established back in April. However, this upper level has been tested four more times since then, if you include the moment in June where price managed to pierce above it with one bullish candle. Each time this price was reached, sellers pushed the price back down into the range below.
As a technical trader, it’s a good idea to have these levels drawn. This example shows you how much easier it would have been to trade this market if you had determined the levels in advance.
How to Find Support and Resistance in the Forex Markets
Before you can hope to use support and resistance in your own trading, it would help to know how to find it. This part of technical trading is both an art and a science.
When I look at a chart today, some things immediately stand out to me. I can recognize certain patterns in the candles as well as the overall shape of the price action, which reveals numerous things and often trading opportunities to me. There are price imbalances, regions of symmetry, and of course, important levels that can serve as support, resistance, or trend lines. This came from years of practice, and lots of trial and error, which beginners won’t have yet.
Fortunately, we are only going to look at the major horizontal levels here, to keep things more simple. Below I’ve put together some steps for you to follow. This should help display how I go about identifying the major support and resistance levels on any forex chart.
1. Locate the single candles with the largest bodies and wicks, and draw a horizontal line at their upper and lower extremes.
When it comes to support and resistance, you are only looking for horizontal lines. As a beginner it will take at least a few hours looking at various charts, ideally in multiple markets. But there is no shortcut for it. If you want to become an expert at identifying levels in advance, you must practice it.
Focus on the largest candles. Find wherever there was a sharp movement in price in either direction, and then imagine a horizontal line right at the top and bottom of those moves. This is where buyers or sellers had come together with enough pressure to put a stop to that candle, at least for the moment. The largest candles stand out the best, and will serve as valid support/resistance more often than not.
Should Traders Be Using Wicks or Closes?
Note that I tend to draw my support and resistance lines based on the wicks. Some traders prefer to use the candle bodies, disregarding the wicks. This give more emphasis to where the market closed in each candle, rather than extreme ranges. This part is perhaps also more art than science, but I have found success using wicks, and so I continue to use them.
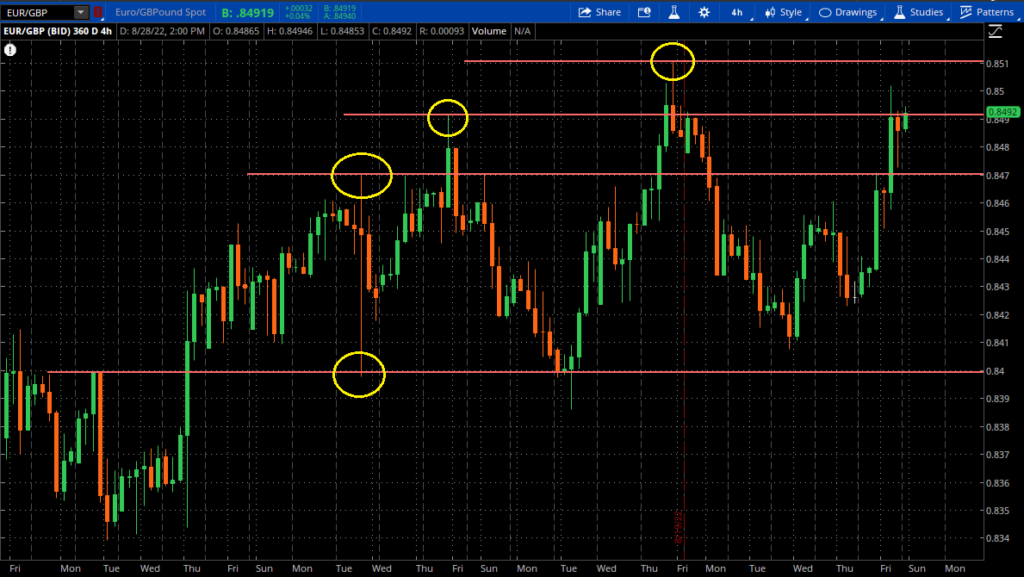
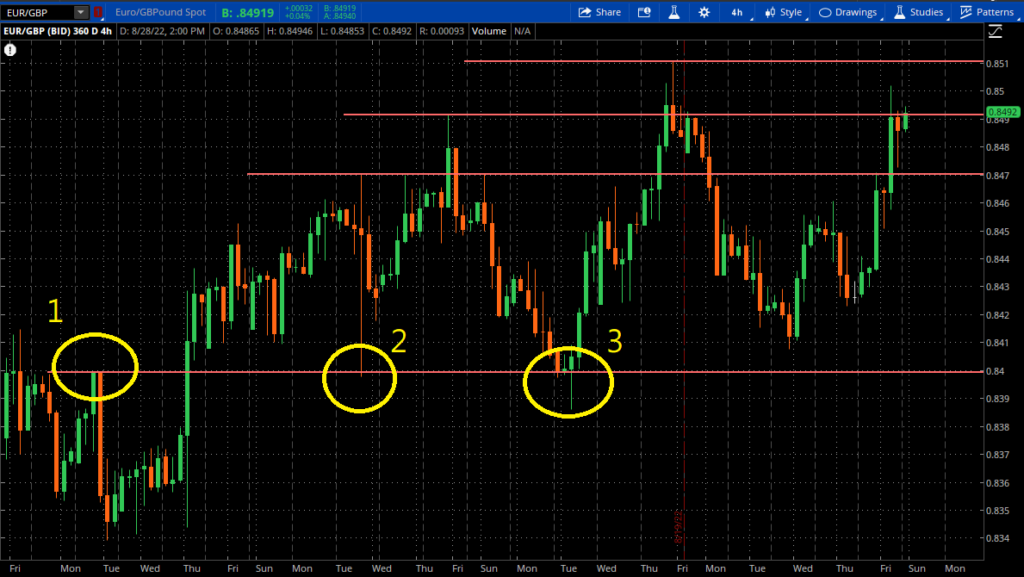
2. Locate the batches of candles that moved in the same direction, but stopped and reversed. Draw a horizontal line at the edge of the end of these moves.
Once you’ve taken note of the single candles, pay attention to the groups of candles that struck a level and struggled to continue in that same direction. Now you are looking to locate areas with multiple candles where the market experienced a fundamental shift in supply and demand. I did not draw all the levels below, but I circled a few that would qualify as powerful reversals for me.
Some candles, like the circled candle at the top of this chart, may count as both a large single candle and a reversal of a trend.
If you notice a level that seems valid but doesn’t work, don’t worry. There are moments where other forces in the market are too powerful. Some trends are so strong that a single support or resistance level will not be able to hold them. Understanding those forces is a separate topic however, so focus on merely identifying all the major support and resistance levels for now.

3. Count the times a particular line has been tested without a significant break
Remember what I said about a mix of art and science? There is no magic number for how many times a level must withstand the price to be “valid.” Depending on the strength of the trend and that particular market, it might hold just once before it’s broken. In another market, it might happen ten times.
As a general rule, the more times a support level holds, the more powerful it is. This is because more technical traders will notice it as it continues to hold. But you shouldn’t consider it a major support level if it doesn’t stand out from the price action around it.
If you notice a support level that used to work, but completely gave away the next time price came to it, don’t expect it to hold again in the future. It can happen, but it’s not reliable. There is likely a better level you can focus on for your next trade.
4. Give higher value to levels where support and resistance reversed
Another concept I must mention is the shift that occurs when support turns into resistance, or vice-versa. This is when price moves past a formerly strong level, and then comes back to that level before reversing again and continuing in its original direction. For example, price may break downward through support, pull back up to the support level, and continue lower.
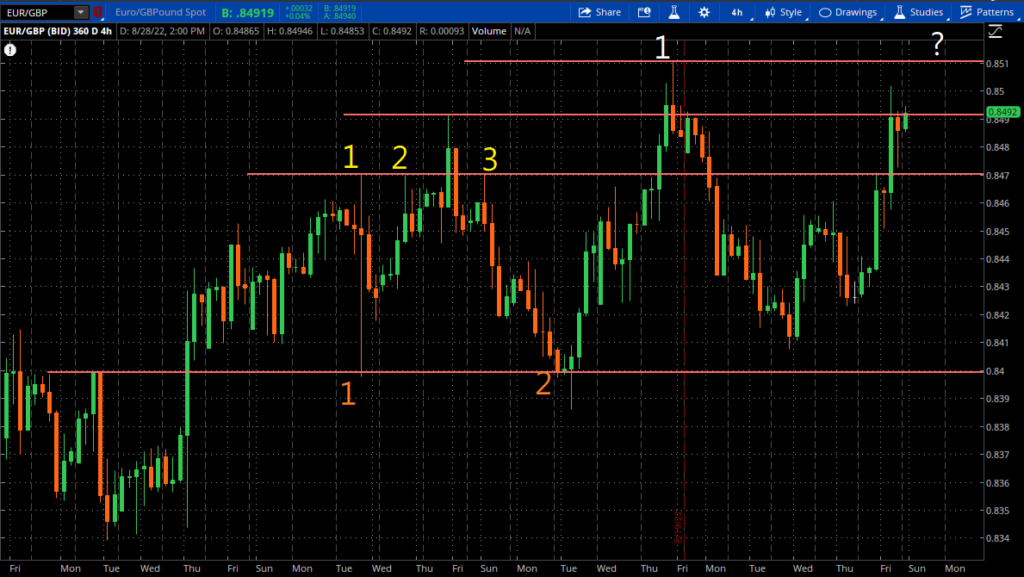
You will often find on a bullish trend that once price breaks through resistance, it wants to test that resistance level again in the future. When it does, that resistance becomes a powerful area of support instead. I’ve added an example of this phenomenon below.
When you notice price coming back down to a former resistance level, watch for how it responds to it. You may find yourself in position to take an incredible trade. In this example, a trader could have gone long once price rebounded from this resistance. There was a profitable trade at circle #2 as well. But the real sustained move began at #3, and is still technically continuing today.
If you find a support or resistance level that is holding in the current market, congratulations! You now have an edge for when price approaches that level. But what are you supposed to do with that knowledge?
How to Make Use of Support and Resistance for Better Forex Trades
Now that you have seen what support and resistance typically look like, it’s time to take advantage of this information.
What I’ve noticed from my own trading is that while support and resistance appear everywhere, they seem to be especially common in forex. I think this is due to the fact that currency pairs typically do not have any strong trends in the short term.
This means that the likelihood of finding a relevant, strong level for either support or resistance appears to be higher in forex markets. Price tends to get caught in narrow ranges more often, where powerful support and resistance levels are easier to establish for longer periods of time than in other markets.
This is good news for forex traders, because it implies that there are great support and resistance trading (and learning!) opportunities all over. If you manage to identify the levels in advance, you can test your understanding of these concepts until you feel comfortable enough to trade them.
If you came for more specific Forex examples, let’s begin.
Example #1: USD/CAD – Daily Chart in August 2022
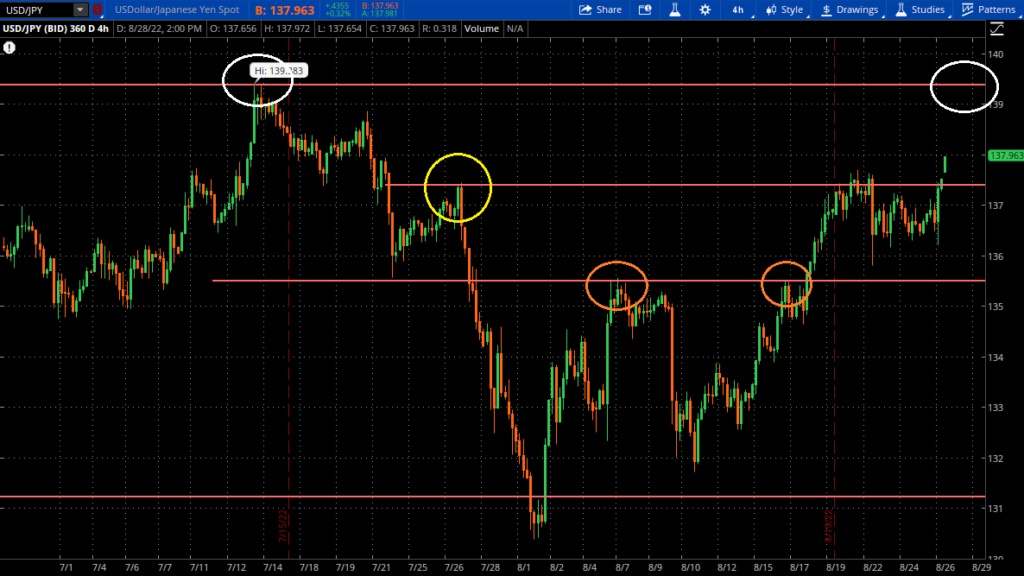
Above is a 4 hour chart of USD/JPY, with several significant support/resistance levels drawn. This market is especially interesting because we had an all-time high only recently in 2022. All-time highs and lows are perhaps the most powerful support/resistance levels, because they are on every competent trader’s radar. It’s especially easy to notice them when your trading software displays them with a prominent white bubble.
If you are a trader looking to trade USD/JPY, you now have the knowledge of these levels in advance. You can consider multiple trades here.
Trade #1
First, the yellow circled area represents a moment where price met resistance and collapsed for several days afterward. We had another test of this level more recently, but price continued higher since then. You might wait to see if price retraces to this level, and respects it. This may line up with a great setup for a reversal at that level. If resistance turns into support, one could enter long with a target around the all-time highs.
Trade #2
If you were going for a longer term, more conservative trade, you can wait for price to return to the level with the orange circles. This level has not yet been tested from above, and is also significant. Look at how rapidly the trend reversed when it first tested it, which was part of step #2. But keep in mind that this is less likely to happen with the current trend. You may risk missing the trade if you wait for too steep of a pullback.
Example #2: AUD/NZD – Weekly Chart in 2022
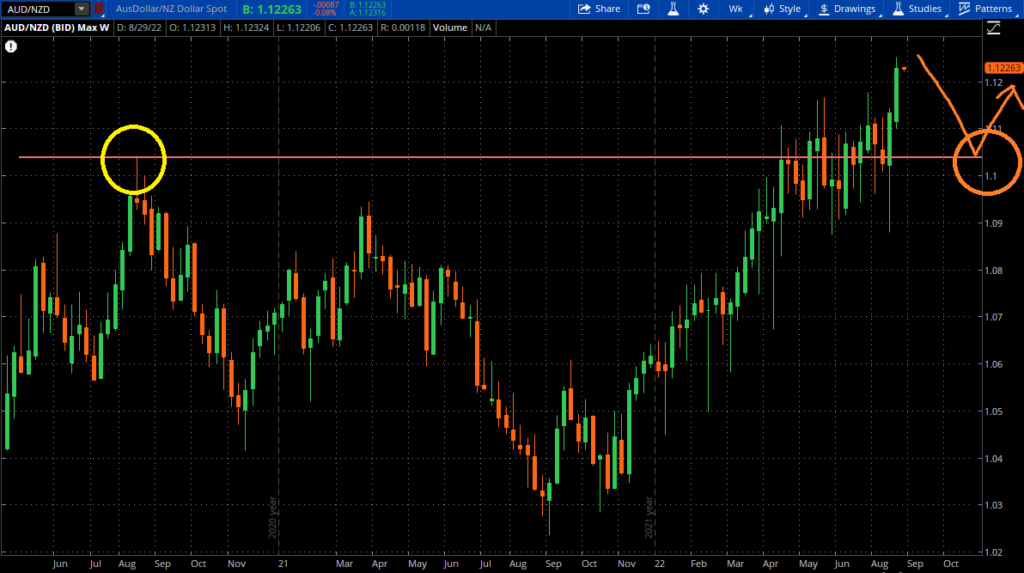
This is the weekly chart of AUD/NZD, and you can see that the market is on a clear bullish trend for several months. It has just recently pushed through a relevant resistance level, drawn from the last high that strongly rejected price, with a powerful bearish gravestone candle. For a longer term technical trader, this is a beautiful setup in the making.
Now that the market has run through this resistance, expect it to turn into support during a subsequent pull back. As a trader looking to go long, this next test of support may be the ideal point to consider an entry. You may have to wait longer than the previous example, because this is the weekly chart. It could be months of watching this market run past this point before it pulls back to test the support. But if you position yourself correctly once the time comes, the wait is often more than worth it.
Conclusion
Traders can find support and resistance levels everywhere in the forex markets. As with any good technical analysis, you can apply these concepts successfully to other markets as well. To some, this suggests that it couldn’t possibly be useful.
But if you learn these principles well, focusing on the more significant levels, you can improve the quality of the trades you take with the confidence that you are trading the same strong levels that other professionals will be considering.
As you learn more, you can use more tools in conjunction with support and resistance. Try combining these concepts with trendlines, symmetrical patterns, and candlestick analysis. As you get better at recognizing these levels, you may find a great setup that uses support and resistance with your preferred technical indicator.
If you are a forex trader looking for a program to get your very own funded Forex Trading account, I recommend checking out the FTMO Challenge here.
Leave a Reply