In addition, any charts for financial instruments in this article are for education only. The examples shown here do not constitute trading advice or a solicitation to buy or sell any financial instrument. Past performance is not necessarily an indication of future performance.
If you would like to learn more, please read this Disclaimer for details.
You may have heard of “breakouts” before in trading. It’s one of the more straightforward concepts once you see it. However, it’s something else to correctly identify the potential for a breakout, and react to a valid breakout in the moment.
Traders who like to look for breakouts try to take advantage of the increased volatility and sharp moves that often result from one. This means a lot of sitting and waiting during a consolidation period, and staying ready to pounce once the opportunity is there. It also means dealing with situations where a breakout fails immediately, reversing and taking the market against the expected direction.
In this article, we’ll examine the process involved when trading breakouts, as well as the conditions required for both valid and false breakouts.
While not every strategy will use them, it’s a good idea to learn their structure either way. During long periods of consolidation, there’s often multiple exceptional setups to take advantage of, leading into the breakout itself. Being familiar with them will get you one step closer to trading mastery. Let’s begin.
What is a breakout?
A breakout is a term used in trading to describe a situation where the price of a financial instrument, such as a stock, currency, or commodity, moves beyond a specific support or resistance level.
If you aren’t familiar with support and resistance, be sure to check this article first. Here’s a quick recap. Support and resistance refer to the levels at which market orders accumulate and market participants battle for control. These levels become critical price points and are used in numerous trading strategies.
When the price “breaks out” of these levels, it indicates a shift in the supply and demand balance, and the potential for a significant price movement in the direction of the breakout. Simply put, a breakout signals a potential trading opportunity, as it may mark the beginning or continuation of a trend.
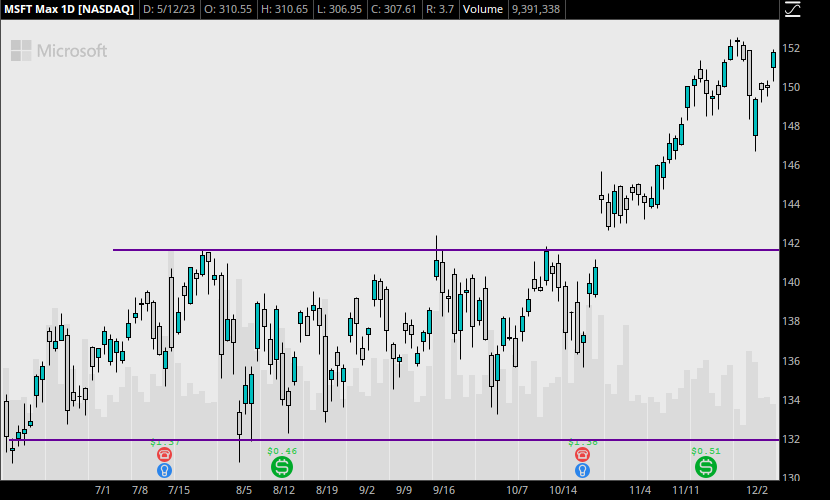
Imagine a stock has a resistance level at $14 per share. Price attempts to go higher but falls back to $132 or $135. This goes on for months, with price getting pushed down every time it approaches $142.
Then, one day, buyers flood the market, pushing it higher than $142 for the first time. This “breakout” would signify to all market participants that something has changed, and that buyers may have taken control.
You can see this take place in Microsoft stock over the last 5 months of 2019.
The Psychology Behind Breakouts
Breakouts are the result of the continuous struggle between buyers and sellers in the market.
When the price of a security is confined within a specific range for an extended period, it indicates a balance between supply and demand. Consolidation periods like this can go on for months or even years in some markets.
However, as new information enters the market, market participants will react to it differently. As they adjust their positions, adding size or taking profit (or losses), the balance shifts. This can be gradual over a long time, or more suddenly if it’s a cascading effect. When the balance shifts enough to cause the pressure on one side to overwhelm the other, a breakout occurs.
If you’re a buyer, and you see price beginning to gain momentum to the downside, you’re probably going to consider exiting some or all of your position.
Imagine you’ve been watching the market struggle to go anywhere for months. One day, the price is falling faster than it had during this entire period, and starting to show new lows.
Are you going to sit on your hands and take the loss with sellers starting to take control? Most investors and traders, especially those who are aware of this pattern, will be exiting positions and even shorting to capitalize on the new weakness. As markets show new prices after long periods of consolidation, everyone takes notice and the new money pushes the market further.
The Types of Breakouts
When a breakout happens, it means the market is reassessing the asset’s value. But there’s different types of breakouts, depending on the market condition and shape of the consolidation period. Sometimes price is making its way higher in preparation for a downward breakout, or vice-versa.
Horizontal Breakouts
These occur when the price moves beyond a horizontal support or resistance level. This type of breakout is often seen in range-bound markets or after a period of consolidation. The example of Microsoft from earlier is a good depiction of a horizontal breakout. Here’s that chart again:
Trendline Breakouts
When the price breaks through a diagonal trendline, either upward or downward, it is considered a trendline breakout. These breakouts often signal a reversal or continuation of the prevailing trend.
Sometimes price will follow a tight period that slopes up during a larger downtrend, or slope down during a larger uptrend. When the breakout begins, all of the market’s energy generated during the consolidation period comes together to send the market down with tremendous force.
Other times, it might simply have reached a point of exhaustion, as in the example below. After an uptrend, AAPL enters a channel that runs out of gas, and eventually crashes once the breakdown occurs.
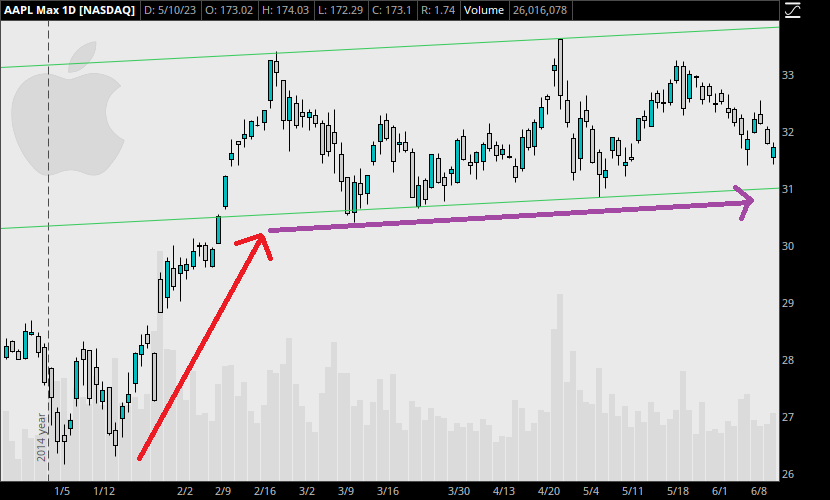
When price finally breaks down below the bottom line, it picks up momentum immediately. Look at the next image, and locate the candle immediately after the successful break out of the channel. Its body is significantly larger than the other candles leading up to it.
There is a brief reversal afterward, followed by an even larger move downward out of the channel.
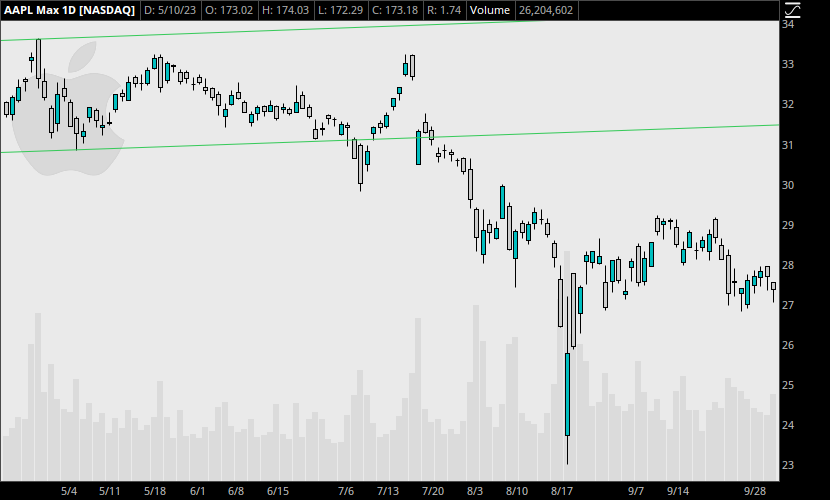
Chart Pattern Breakouts
Certain chart patterns, such as triangles, rectangles, and head and shoulders, can act as precursors to breakouts. When the price moves beyond the boundaries of these patterns, it is a chart pattern breakout.
False breakouts and How to Counter Them
As promised, I will now go over one of the trickier aspects of this phenomenon. False breakouts, also known as “fakeouts,” occur when the price appears to break through a support or resistance level but quickly reverses. This traps unsuspecting traders who entered on the breakout expecting a longer run.
False breakouts can result from temporary imbalances in supply and demand, market manipulation, or stop hunting by large market participants. So how do we avoid getting trapped? If you are considering implementing breakouts in your strategy, there are a few ways to do it. But be sure you are familiar with candlestick analysis first, as candles play a big part too.
Good traders use techniques such as waiting for confirmation through the close of the breakout candle, analyzing volume, or looking for a retest of the breakout level. Better traders combine multiple patterns and indicators to get a better understanding of the big picture. However, no method is foolproof on its own.
To have any chance, be absolutely sure you have assessed the underlying trend correctly. For example, if the daily trend is up, and you entered a breakout to the downside on the 1-Hour chart, you might not find a significant move due to the underlying trend. Unless it’s a special circumstance, this kind of breakout is probably not worth the effort and risk.
Instead, pay attention to nearby support and resistance on the 1-Hour chart, and if the market seems to struggle at a clear level, it might have been a false breakout. Sometimes the market will simply break out of a range to test a significant level, and then reverse to resume its original trend.
Breakout Trading Strategies
There’s several ways to trade breakouts or implement them into a wider strategy.
Consolidation Breakouts
If you want to keep it simple, you could simply look for a breakout from consolidation and take profit at a predefined distance based on the size of the channel.
Trend Continuation Breakouts
What I’d recommend is to instead try to trade according to the prevailing trend. This way, even if there’s false breakouts against your position, they will be smaller, and the trend will likely correct the market sooner than if you were trying to fight the market’s current.
Chart Pattern Breakouts
Trading breakouts from chart patterns add complexity and precision, if used properly. These patterns often indicate potential future price movements due to the extra information available. In addition, if there’s a larger pattern in play, the fact that there is a breakout confirming the strength of the pattern can be powerful.
Examples of chart patterns that can lead to breakouts include triangles, rectangles, and head and shoulders patterns.
Trading False Breakouts
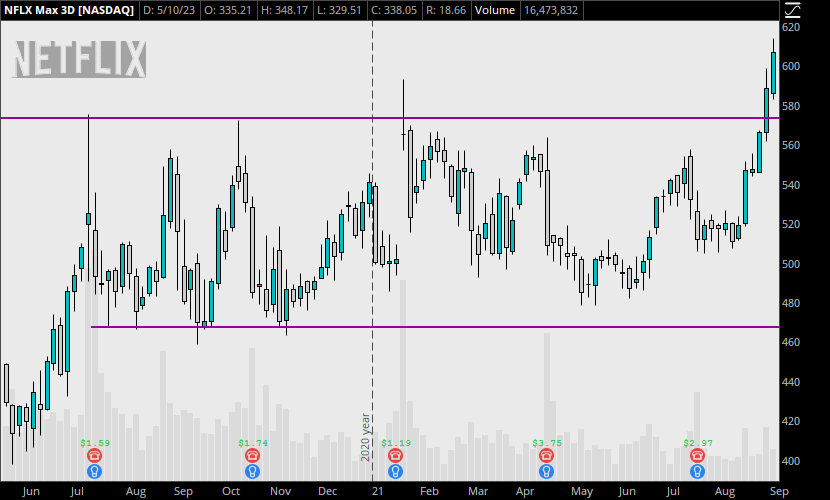
It’s hard to avoid overcomplicating this level of technical analysis. But to add yet another level of depth, you might consider trading a false breakout as well. In the NFLX example above, trading the false breakout would mean shorting on the candle that pierced the resistance. This is not something I recommend new traders trying to attempt, especially because it involves shorting a stock, but it can be done.
If you’re interested in learning about trading false breakouts, I might put together an article for that topic. But until then, I’d suggest avoiding this type of strategy altogether, until you are more experienced.
Conclusion
It’s fair to say that learning how to trade any complex strategy will take some serious dedication and time. Trading breakouts, especially when taking false breakouts into account, is no exception.
Try to keep it simple by following the five steps outlined in this article, and use the drawing tools in your charting software to make sure you’re identifying the right levels. If you take the time to prepare in a rangebound market, you can be poised to catch the breakout when it occurs. But if you wait too long, you might get lucky, but you’ll be prone to bigger losses during a fakeout.
It’s also a good idea to take a little extra time to get acquainted with the main chart patterns, as well as candlestick analysis. This includes support and resistance, head and shoulders, cup and handle, and more.
Trading breakouts can be more stressful than other types of trades, and this cannot be understated. Don’t chase the action and fall victim to FOMO. But with enough practice, you might consider making them part of a larger strategy. Good luck!
Leave a Reply