In addition, any charts for financial instruments in this article are for education only. The examples shown here do not constitute trading advice or a solicitation to buy or sell any financial instrument. Past performance is not necessarily an indication of future performance.
If you would like to learn more, please read this Disclaimer for details.
As an experienced trader, when you hear “Head and Shoulders”, the following pattern should immediately come to mind.
Are you able to see the shape that gives this pattern its name? The Head and Shoulders pattern is one of the most powerful and highly regarded chart patterns in technical analysis. It signifies a transition from an uptrend to a downtrend, which often comes in the form of a sharp selloff.
But this pattern doesn’t just work as a short signal, because the inverse head and shoulders exists as well. The inverse is used to forecast bullish moves, though it is used and recognized less than the standard pattern.
In this article, we’re going to analyze the different components that make up the head and shoulders pattern, explore its inverse counterpart, and see some of the limitations and pitfalls that can trap beginner traders. By the time you finish reading this article, you should hopefully have a few ideas to test out in your own trading. Let’s get started!
What is the Head and Shoulders Pattern?
Traders use the Head and Shoulders pattern provides a visual representation of the struggle between buyers and sellers. Any pattern or indicator that can depict changes in market sentiment quickly becomes a powerful tool in the hands of an experienced trader. But what are we looking at exactly?
The Head and Shoulders pattern consists of three distinct peaks resembling a human head and shoulders. This pattern develops in different stages and, depending on the time frame, could take anywhere from 15 minutes to months to fully develop.
As the head and shoulders forms during an uptrend and requires multiple ups and downs to complete, it would not be noticeable initially.
The left shoulder first forms as the price rises and reaches a local high before retracing downwards. This retracement creates the first low point, which becomes part of the neckline.
The head forms when the price subsequently rises to a higher peak than the left shoulder and then declines again, creating a second low point that adds to the neckline.
The right shoulder, usually smaller than the head, forms as the price rises one last time but fails to reach the head’s peak before falling. The right shoulder’s low point connects with the previous lows to complete the neckline.
The pattern is considered complete when the price breaks below the neckline, indicating that sellers have taken control and a new downtrend is likely to begin.
Inverse Head and Shoulders
The Inverse Head and Shoulders pattern is just the opposite. It forms during a downtrend and signifies a potential reversal to an uptrend.
Instead of three peaks, now we’re looking for three troughs, with the middle trough (head) being the lowest, and the two surrounding troughs (shoulders) being higher.
The left shoulder forms as the price declines to a local low before retracing upwards. This retracement creates the first high point, which becomes part of the neckline.
The head forms when the price subsequently declines to a lower trough than the left shoulder and then rises again, creating a second high point that adds to the neckline.
The right shoulder, usually higher than the head, forms as the price declines one last time but fails to reach the head’s trough before rising. The right shoulder’s high point connects with the previous highs to complete the neckline.
The inverse head and shoulders pattern is considered complete when the price breaks above the neckline. Buyers should look to get in sometime during this final shoulder’s completion.
Importance of Volume
Trading volume can play a crucial role in confirming the Head and Shoulders pattern.
Ideally, volume should decrease as the pattern forms, with the highest volume occurring during the head’s formation and the lowest volume during the right shoulder’s formation. When the price breaks the neckline, volume should increase, signaling the pattern’s completion and the start of a new trend.
This increase in volume serves as a confirmation signal that the pattern is valid and that the trend reversal is likely to continue.
Conversely, a weak volume breakout may suggest a lack of conviction from market participants, increasing the risk of a false breakout and a continuation of the previous trend.
Identifying Head and Shoulders with an Example
To recognize the Head and Shoulders pattern on a chart, follow the steps below.
A) Identify an existing trend (uptrend for regular pattern, downtrend for inverse pattern).
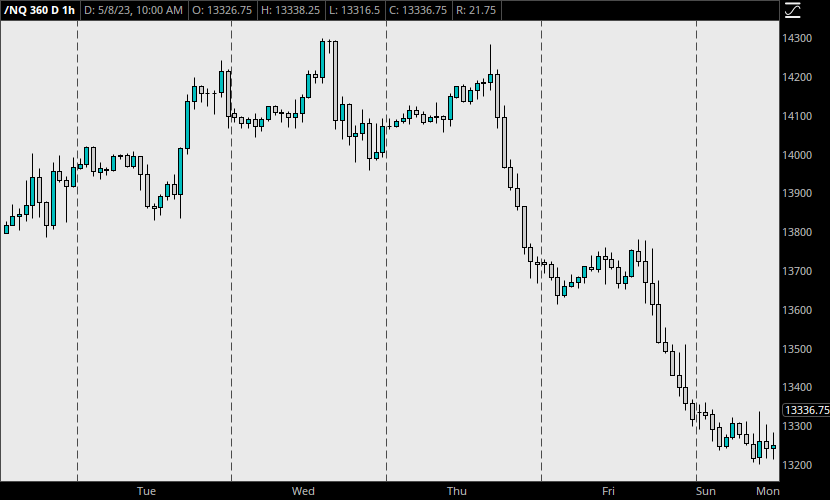
See the chart below, from April 18-24, 2022. This is an example of the head and shoulders forming over a period of about three days, on the 1-hour chart for NQ futures.
Consider it in three phases where the market went up, sideways, and then down. Does the uptrend, peak, and pullback formation stand out?
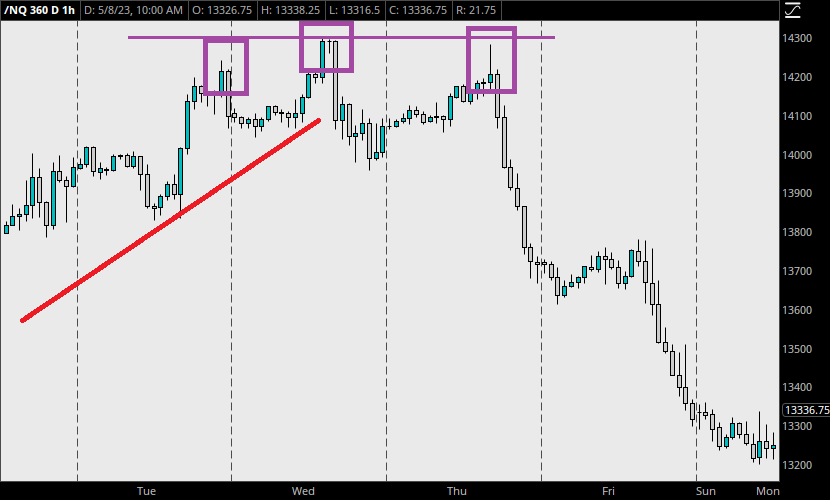
B) Look for three peaks (regular) or troughs (inverse) with the middle peak/trough being the highest/lowest.
Some drawings were added to help make the structure more understandable. The red line shows the clear uptrend, while the purple boxes show the three peaks.
C) Ensure that the left and right shoulders are relatively symmetrical in height and distance from the head. This symmetry indicates a balance between buyers and sellers, making the pattern more reliable.
It’s okay that the second shoulder is slightly higher or lower than the first. The second shoulder is also a slightly further distance from the head when compared to the distance between the left shoulder and the head. Ideally, though, the prices should be similar, and these distances should be comparable if not equal.
The horizontal purple line shows that the peak (head) is higher than both shoulders, and you can visually determine that the shoulders are not too asymmetrical.
D) Draw the neckline by connecting the lows (regular) or highs (inverse) between the shoulders and the head. The neckline can be horizontal, upward sloping, or downward sloping, depending on the pattern’s formation.
Notice that when we connect the lows on the chart between the shoulders, we find a downward sloping line.
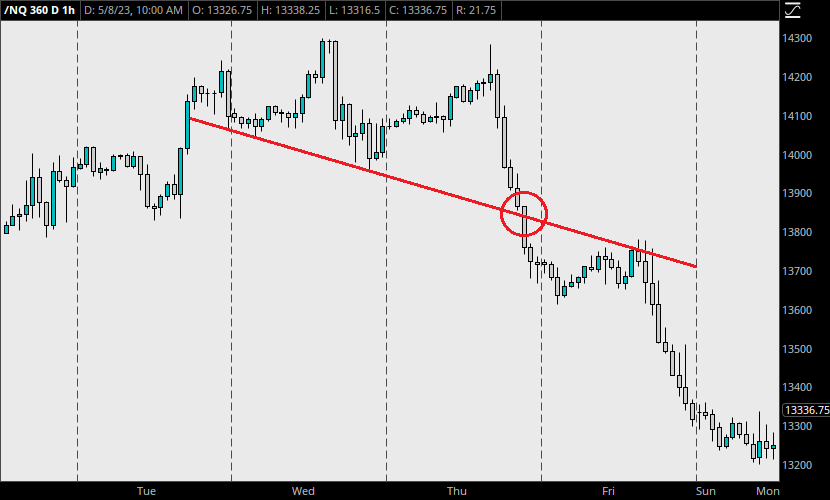
E) Monitor for a price break below (regular) or above (inverse) the neckline, confirming the pattern’s completion. The break should be accompanied by a significant increase in volume to validate the trend reversal.
Volume Confirms the Pattern’s Strength
The above example involves NQ futures, and the neckline breaks sometime in the late morning, Because activity is always high during US hours, the volume won’t make a difference.
However, in the stock market, especially in larger time frames, it’s common to see the volume spike in these situations. Sellers flood the market immediately when the pattern is completed, and stop losses get triggered to close long positions, creating a domino effect.
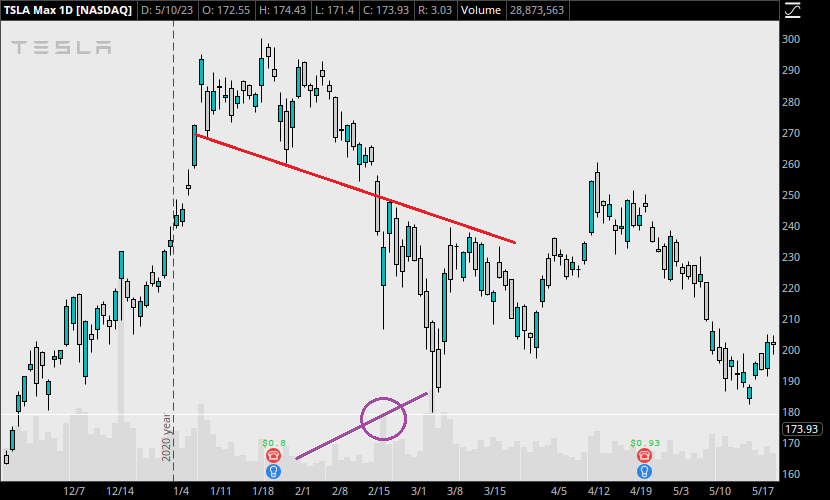
In the chart below, TSLA stock began to fall after the head and shoulders completed in January, 2021. First, price broke below the neckline, and closed below it. Look at how the market behaved after.
The purple trendline shows the increase in volume that occurred leading into the breach of the neckline and afterward. The volume of the first day after the break is circled in purple. As price continued falling, volume spiked multiple times up to about the same level. The market rebounded momentarily, but ultimately continued lower over the next two weeks.
We can notice the increased volatility as well, as the market demonstrates the power of this pattern. Orders were
It’s essential to remain patient and wait for the pattern to complete before taking any trading action. Acting prematurely can result in entering trades based on incomplete or invalidated patterns, increasing the likelihood of a failed trade.
Trading the Head and Shoulders Pattern
When trading the Head and Shoulders pattern, there’s a few ways to do it. If you’re interested in precision, you might position your entry at the confirmation of the second shoulder, to catch the move all the way down to the neckline.
Other traders might enter at the break of the neckline. If you want complete confirmation that the pattern is valid, this is a safer way to play it. Let’s stick to the basics and enter based on the neckline.
A) Entry point
Enter a short position (regular) or long position (inverse) when the price breaks the neckline, ideally accompanied by a surge in volume. Volume increasing is not necessary for this trade to work, but it may be used as a secondary confirmation for some.
On the other hand, if you see volume decreasing, you might consider passing up the trade.
B) Stop loss
Place a stop loss above the right shoulder (regular) or below the right shoulder (inverse). If the market makes it back to this shoulder level, the pattern is invalid. Ideally, it won’t even attempt to, but if you made a mistake in identifying the pattern or the underlying trend, it is possible that the market will simply continue on its upward trend if the pattern was not applied correctly.
C) Profit target
Calculate the price target by measuring the vertical distance from the head’s peak/trough to the neckline and projecting it from the breakout point. This projected distance represents the minimum expected price movement following the pattern’s completion. In the following example, you will see why it is a minimum and should be treated as such.
A Head and Shoulders Swing Trade Example
Let’s use another TSLA trade for this example. Imagine we’ve already identified the peaks and the neckline, and we’re waiting for the neckline break. This takes place on September 30, 2022. As soon as price breaks, we have our order ready and enter short, with 10 shares at $249.25 per share. Our position size is $2492.50.
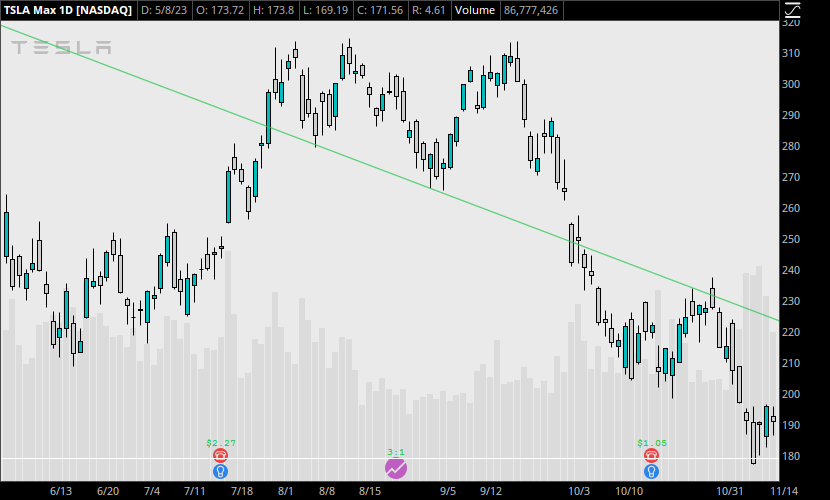
Because the right shoulder is at about $313.80, our risk would be $64.55 per share, or $645.50. This is a substantial risk, but it’s what’s required by waiting for the neckline break. The market has to move quite a lot to reach a downward sloping neckline, compared to when the neckline is horizontal or sloping upward.
Now comes the tricky part. To determine the profit, we need to measure the distance from the peak to the neckline, and then project it downwards. In this case, the trend is so powerful, it continues for quite some time beyond this initial price target.
Also, note again that the neckline became resistance for the move to pull up to, rebound off of, and continue lower.
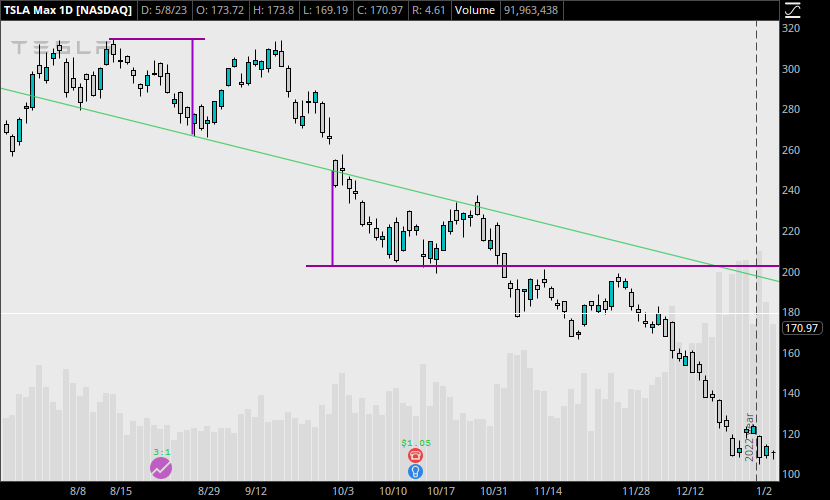
In this example, if we take our profit at the lower horizontal purple line, we exit at $202.30. We earn about $46.95 per share for a total profit of $469.50.
However, there’s more to this trade. For one, the candles don’t signify a reversal at the profit target, even though the market does stop momentarily here. The neckline provides a powerful resistance level as well. So we might re-enter at the neckline, or take half our position off at $202.30 and hold for a lower break.
Re-entering at the neckline resistance
If we re-enter at the neckline, we can take advantage of what becomes a massive selloff over the next 2 months. TSLA prices hit a low of $101.81 in early January, which would produce another $1018 profit on the same trade.
This is mostly a standard Head and Shoulders pattern application, albeit with a higher right shoulder than we’d like. But it just shows how powerful this pattern can be.
Limitations and False Signals
The Head and Shoulders pattern has some limitations, including the possibility of false signals.
False breakouts can occur when the price appears to break the neckline but then quickly reverses, invalidating the pattern. To reduce the risk of false signals, use additional technical indicators, such as moving averages, to confirm the pattern and the trend reversal.
Furthermore, stay cautious when the pattern’s components are not well-defined or when the neckline is not clearly visible. If the pattern is unusually congested or unclear, it might be invalid.
Another limitation comes with varied application. As you saw above, waiting until the neckline break can be a form of confirmation, but also limits potential profits substantially at times.
Some traders will find varied success, if any, when modifying their approach too much. Try to stick to the fundamental principles of the Head and Shoulders, and stay consistent with its applications. If a trade doesn’t look or feel right, there’s no harm in skipping it, and simply observing it to learn something new.
Conclusion
In conclusion, the Head and Shoulders pattern, along with its inverse counterpart, is well-known for good reason. While it is used in all markets, it provides one of the most powerful ways to enter a longer term trade in the stock market with significant percentage gains.
Study different instances of the head and shoulders to get familiar with each of the stages and shapes that develop. Check examples where the shoulders are level, and when there’s varying slopes. Use other indicators to figure out when the market will run beyond the initial price target. It will not always do so with the same force as the TSLA example above.
Finally, be aware of the limitations and apply it in a consistent fashion, as I’d advise with just about every general chart pattern or indicator. There will naturally be many differences across different market contexts, but the fundamental principles should remain the same.
Leave a Reply