In addition, any charts for financial instruments in this article are for education only. The examples shown here do not constitute trading advice or a solicitation to buy or sell any financial instrument. Past performance is not necessarily an indication of future performance.
If you would like to learn more, please read this Disclaimer for details.

The cup and handle is one of the most well-known technical analysis chart patterns out there. While not intuitive from its name, this pattern signals the likelihood of a bullish move in the near future.
First defined by William J. O’Neil, a stockbroker and founder of the financial newspaper Investor’s Business Daily, this pattern now sees use by millions of traders worldwide. In his book “How to Make Money in Stocks“, O’Neil detailed the cup and handle as a highly reliable pattern often preceding significant price advances.
We’re going to look at how this pattern looks, and what you can do to take advantage if you notice it developing during one of your trading sessions.
In addition to the standard cup and handle, we’ll take a look at its inverse as well. Just like with other significant chart patterns like the head and shoulders, this pattern may appear upside down. Let’s begin.
The Cup and Handle Shape
The Cup and Handle pattern is typically sought out on a daily chart. Like any pattern, though, it can be identified on various time frames. It takes place in three stages.
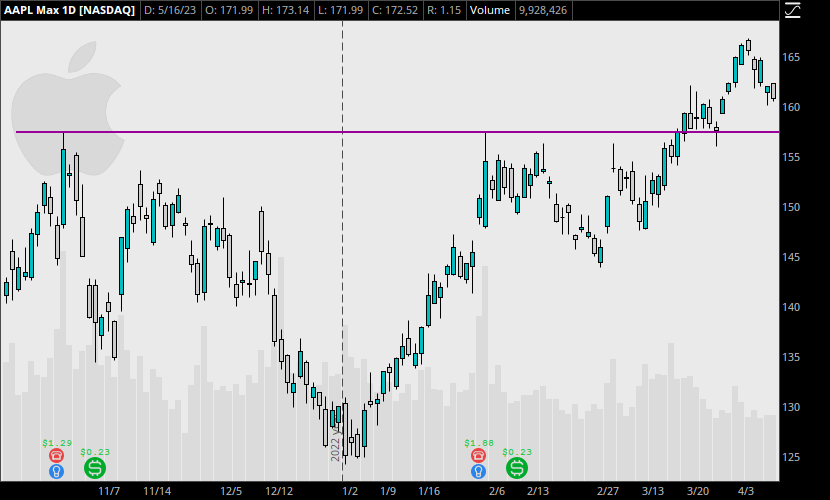
The Cup: The cup forms after an upward trend once the price falls, develops a U-shaped base, and then rises back to the original level before the fall. It should be fairly symmetrical, and the depth of the cup should not be lower than the trend’s starting point.
The cup’s formation often reflects a market correction or consolidation period. The breakdown and subsequent recovery of price signifies a decrease of selling pressure. Buyers regain control of the overall trend, and this signifies a potential continuation during a bullish trend.
The Handle: The handle forms immediately after the right side of the cup reaches the same level as the left. It is characterized by a relatively small price decline, typically less than 50% of the cup’s depth. The handle often resembles a flag or pennant pattern.
You’ll often find either a downward-sloping trend channel or a sideways range. This section represents a final shakeout before the stock resumes its upward trend.
The Breakout: After the handle, look for a breakout above the resistance level, marked by the brim of the cup. This breakout confirms the pattern and indicates that the price should continue to rise. Get familiar with the concept of breakouts if you haven’t already. They play an integral part in the way the cup and handle price action proceeds.
The pattern can also be considered complete once the price breaks above the upper trendline of the handle. You might find increased volume during this period, signaling strong buying interest.
Trading the Cup and Handle
Most of the time, trading the cup and handle pattern involves a lot of waiting.
You must first wait for the cup to fully form, and then watch to see how the handle develops. When the breakout begins after the completion of the cup, without forming a handle, don’t get too eager.
It’s tempting, I know. The market can sometimes run without completing the pattern, due to another successful pattern or market situation that demanded a bullish move.
But don’t give in to the FOMO. Patience is key. When the handle does fully form, traders usually enter a long position upon seeing the breakout which follows. This might be the first candle close outside of the range, or even the first printed price above the resistance level. Some traders also enter right at the break of the resistance level which rests on the brim of the cup.
A stop-loss is typically placed just below the handle’s lower trendline. If price falls back into a channel like during a fake breakout, look out. I would consider the trade to already be showing signs of invalidation, but this is open to interpretation. It might be a short retracement before taking off, in some situations.
The price target for the trade is often determined by measuring the depth of the cup and projecting that distance upwards from the breakout point.
The Inverted Cup and Handle Pattern
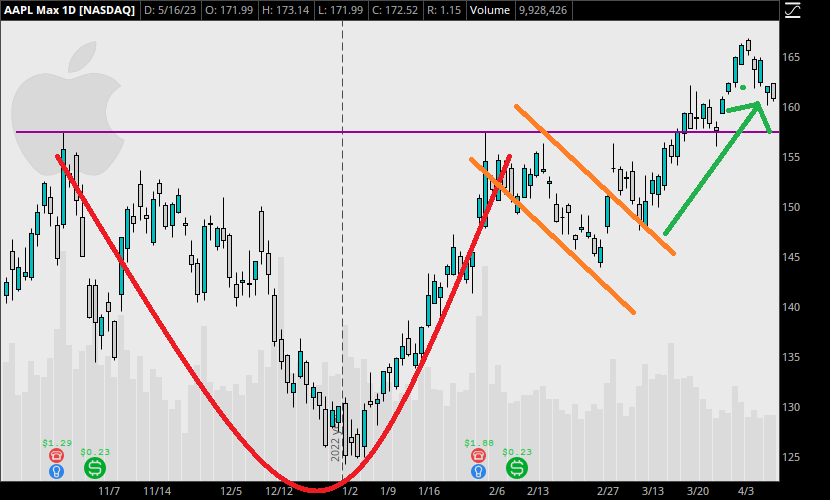
As with almost all patterns, there is an inverse of the cup and handle as well. This variation adheres to the core principles of the cup and handle pattern but plays out for the continuation of a bearish trend.
You can imagine this by just flipping the Cup and Handle pattern upside down. When price consolidates at the top, and then trickles down to form a mountain, traders look for a move upward that corresponds to the upside-down handle. This pattern indicates that price is looking to emerge out of the range and explode downwards to continue the bearish move.
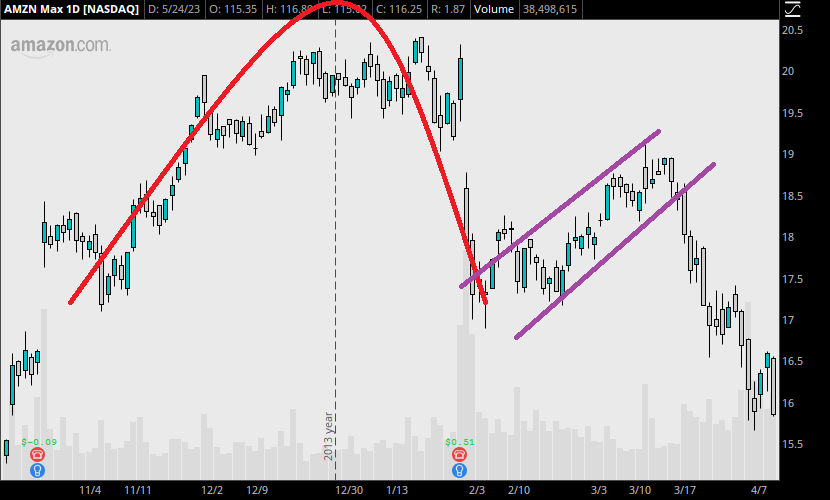
Inverted Cup: This part of the pattern forms after a notable upward trend. The price rises, peaks, and then falls in a rounded shape, similar to a dome or an inverted U-shape.
Handle: Following the formation of the inverted cup, the price experiences a smaller upward trend, forming the handle. This is typically a retracement of the cup’s decline, and it should not retrace more than 50% of the drop.
Breakout: The pattern is confirmed when the price breaks down below the handle’s support line. The breakout should ideally occur on higher trading volume, indicating strong selling pressure.
Limitations of the Cup and Handle Pattern
Despite its popularity and potential profitability, the cup and handle pattern isn’t without its risks and limitations.
For instance, false breakouts can occur, where the price seems to break the handle’s resistance but then falls back. This can potentially lead to losses if the trader has already entered into a long position.
In addition, this pattern is rare compared to some other simpler, shorter term patterns. If you are looking for it on the daily chart, you may be waiting quite a long time. Even scanning hundreds of stocks, you won’t see it around every morning you show up to trade.
The greatest limitation in my opinion is that the pattern is somewhat limited due to its definition. By waiting until the full cup completes, traders miss out on the entire recovery of the drop that forms the left half of the cup. More experienced traders would likely prefer to take profits during the entire shape of the cup, which requires more knowledge and understanding of other patterns and indicators.
However, this is not the end of the world. Sometimes, you simply catch the market when the cup has already formed, and there’s no need to worry about missing the earlier trade. By identifying what has developed, you can always take advantage of the setup that’s forming in front of you.
Cup and Handle Trade Example
Now let’s look at how a trader might a short term Cup and Handle pattern, and what the numbers look like. Checking TSLA’s 15 minute chart, we can find a valid Cup and Handle in March, 2023. Note that the edges of the cup are quite steep in this example, and the bottom of the cup is not as round as we want.
However, this pattern is still valid. We have a consolidation at the base, and an almost perfect recovery to the brim of the cup. The symmetry is undeniable.
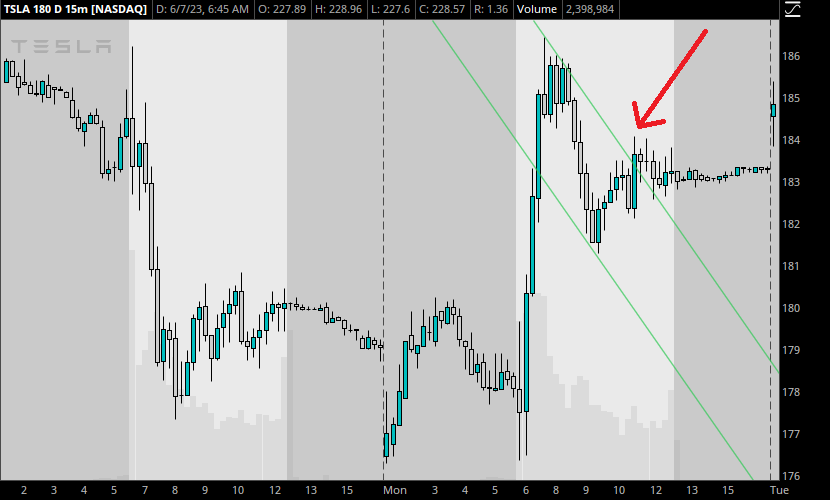
Do you see how the trendlines were drawn to form the handle? You may enter on a different condition, such as a specific candle formation or on a re-test of the channel, but it’s important to wait until the handle has fully formed.
Seeing this setup, our trader decides to go long after price breaks out of the channel that forms the handle. This means waiting during the pullback from 186 to 182, and then entering long at the first close outside of the breakout, noted by the red arrow.
Going long with 10 shares at the close of $183.65, our trader opens a position and watches for the market to move higher.
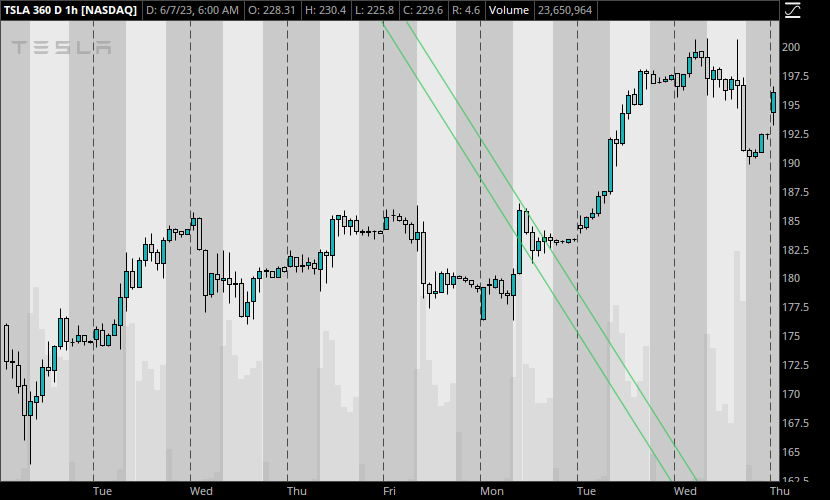
Over the next few days, this happens. As TSLA rises toward 200, our trader has a profit of about $170 in about two days. If we exit at $199 per share, our profit is roughly $15.35 per share, or a total of $153.50. On a position of 10 shares at $183.65, this comes out to 8.3% profit. Not bad for two days.
Where to Exit After the Breakout on a Cup and Handle
Exiting this trade comes down to your personal preferences. If you are a longer term trader, you might aim to hold this position for several weeks, as the trend remains bullish. Shorter term traders might choose to take profit at the first signs of this move pulling back, which occurs around $200.
Traditionally, traders measure the depth of the cup and project it upward from the brim. The depth in this example is about $10. If we follow these rules, our exit would have to be roughly $10 above the brim, or $196.50.
I recommend sticking to the time frame that you find the pattern on. If we use this example on the 15-minute chart, we can expect the trend to run for a few days at the most, before we need to reassess the market. If you are aiming for 3 or 5%, your profit target is reached almost immediately.
For those who are trading with pure technicals, the exit comes at around $197.20 just before the Tuesday close. A strong bearish harami on the 15-minute chart signals an exit here, where I would strongly consider exiting if I had not already.
Is it a coincidence that this exit signal came around the same point as our projection above? Food for thought.
Conclusion
The cup and handle pattern is a valuable tool in the trader’s arsenal, like any other main pattern we cover here. However, like all forms of technical analysis, it should be used as part of a comprehensive trading strategy that includes sound risk management and the use of additional confirmatory indicators. The example trade shown did not reference any indicators or other analysis tools, but you should always consult at least one.
The beauty of this pattern is that it often takes place in the middle of trends. When the market offers this pattern for a bullish continuation, it is an opportunity to enter a trend you may have thought you missed.
Using patterns like these allows you to safely enter the market at points where you won’t have to worry about a steep drawdown. However, utilize responsible risk management and apply your technical analysis concepts correctly. Let me know if it works out on your next trade. Good luck!
Leave a Reply