In addition, any charts for financial instruments in this article are for education only. The examples shown here do not constitute trading advice or a solicitation to buy or sell any financial instrument. Past performance is not necessarily an indication of future performance.
If you would like to learn more, please read this Disclaimer for details.
When it comes to technical analysis, there’s quite a lot of resources out there. Today, almost any term related to technical analysis is well-documented and defined on the internet or in books. This makes makes it easier to learn than ever before. At the same time, though, where are you supposed to start? And how do you continue if you don’t want to sign up for a course?
If you’re new to trading, however, you’re probably unfamiliar with the term. Technical analysts use the study of price movement and patterns to make their decisions in the market. This is the key to any truly successful trading strategy. By removing the other information related to a particular instrument, traders aim to capitalize strictly on the effects of the never-ending struggle between supply and demand.
While long-term investors often prefer to apply fundamental analysis, technical analysis has been proven to be powerful and usually much more accurate than any other method.
This doesn’t make it easy, though. Even within the world of technical analysis, there’s a sea of information and different strategies that you can use with varying success. In this article, I’m going to share some of the best books out there so you can start learning all about it.
- “Technical Analysis of the Financial Markets” by John J. Murphy (1999)
- “Japanese Candlestick Charting Techniques” by Steve Nison (1991)
- “A Complete Guide to Technical Trading Tactics” by John L. Person (2004)
- “Evidence-Based Technical Analysis” by David Aronson (2006)
- “The Encyclopedia of Chart Patterns” by Thomas Bulkowski (2000)
- “Chart Patterns: After the Buy” by Thomas Bulkowski (2016)
- “Bollinger on Bollinger Bands” by John Bollinger (2001)
“Technical Analysis of the Financial Markets” by John J. Murphy (1999)

Murphy’s “Technical Analysis of the Financial Markets” is often considered the bible of technical analysis books. It’s been a staple on traders’ bookshelves for over two decades.
If you’re completely new to all of this, this book might be the ideal starting point for you. Murphy provides a thorough overview of the field and introduces concepts from basic charting techniques to more complex market theory. The inclusion of modern computer technology, which revolutionized technical analysis, ensures that readers gain an understanding of the current landscape of the field.
While technical analysis applies to the study of price action and predates computer systems, you should know that the field has changed dramatically in terms of accessibility, efficiency, and depth due to the advent of automation.
Murphy’s extensive use of real-world examples is complemented by illustrations. The book is filled with charts and visuals, and even if you’re not a visual learner, you will benefit.
However, it’s fair to say that the breadth of content in this book can be a bit overwhelming to a complete beginner. I still recommend it, because I think it will save a lot of time to start with this. But if you’re struggling to get through some concepts, don’t worry too much. You can always make a note of the complicated topics. You’ll likely come back to it later when you have a better fundamental understanding.
“Japanese Candlestick Charting Techniques” by Steve Nison (1991)

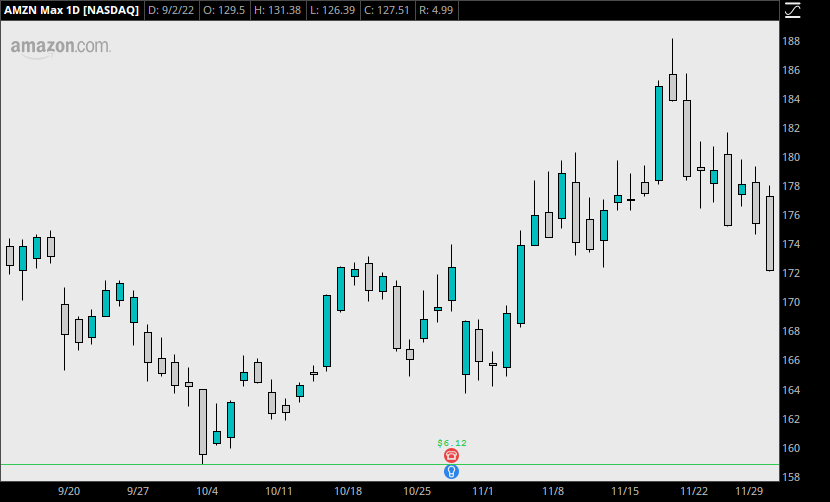
Nison’s work introduced the Western world to Japanese candlestick charts, a graphical representation of price movements that goes back to the 17th century.
If you’re unfamiliar with candlesticks, they refer to a type of price chart like the one below. These candlesticks are perhaps the most important tool any technical trader can have. They depict price in an easy-to-consume way, without leaving out any critical core information.
Steve Nison’s book is considered a classic, and a groundbreaking contribution to the field. Prior to this book, these techniques were largely unknown outside of Japan.
One of the unique strengths of Nison’s book is the detailed explanation of each candlestick pattern, both in terms of its construction and its interpretation. Bulkowski’s book (further down this list) goes even further into candlesticks, but Nison does a good job of showing why these patterns continue to work.
Homma Munehisa is the name of the legendary rice trader who invented candlestick charts in the 18th century. A popular quote from the book is, “As Homma wrote: ‘When all are bearish, there is cause for prices to rise. When everyone is bullish, there is cause for prices to fall.’” If your goal is to become successful at this, you should learn this now. There is no shortage of opportunity for the educated trader.
“A Complete Guide to Technical Trading Tactics” by John L. Person (2004)

John Person is a 30-year veteran, well-versed in Futures and Options and Technical Analysis as a whole. His book “A Complete Guide to Technical Trading Tactics” does a pretty good job of covering all of the basics, but goes a step further in a personalized approach.
Perhaps the most unique feature of Person’s book is the introduction of his own trading system, known as the Person Pivot Indicator (PPI). He gives a detailed discussion on how to use PPI to predict market turns and to identify potential buy and sell signals.
Person’s Pivot Point analysis combines standard pivot point analysis with his own proprietary formula. Many traders believe it to be a more accurate prediction tool.
If you’re new to trading, it’s likely you have no real inclination toward a particular strategy. You might have heard about following trends or buying undervalued assets, but neither of these blanket terms help a trader actually make any money. If the PPI strategy works out for you, this book will be an invaluable resource to say the least.
Person also offers in-depth guidance on using technical analysis to trade options. Options, while more complex and requiring more variables, are often not covered in depth in many technical analysis books.
“Evidence-Based Technical Analysis” by David Aronson (2006)

David Aronson’s book “Evidence-Based Technical Analysis” is a rigorous, data-driven examination of many trading strategies. He offers an objective assessment of technical analysis methodologies that you may or may not be familiar with. This helps in making a more informed decision about how to approach trading as a whole.
When there are a million traders out there, it’s easy to find someone who claims they have a good strategy. It’s harder to see a more objective, scientific analysis of their strategy, if they share it at all.
David Aronson tries to question the traditional subjective methods of technical analysis, which is a topic that deserves its own discussion. What’s interesting and controversial is that he does not seem to believe in technical analysis the way I and other traders do.
“The conventional methods used by TA rule developers almost guarantee that rules will be discovered, but the discovered rules will be random, chance occurrences, not grounded in persistent market inefficiencies. Therefore, the discovered rules lack true value and will fail to generate profits when used for live trading.”
Whether you agree with him or not, it’s certainly interesting to get another perspective on the topic.
Aronson also offers a comprehensive introduction to the concept of ‘data mining’ and ‘out-of-sample testing.’ He describes how some traders use data mining discover valid patterns and indicators, significantly more efficiently than trying to do it by hand. Out-of-sample testing refers to validation of performance of a trading rule on fresh data, separate from the data that was used to define the rule initially. It may seem obvious after you’ve worked on algorithms, but this crucial element is not discussed much in technical analysis books.
“The Encyclopedia of Chart Patterns” by Thomas Bulkowski (2000)

Perhaps the best reference book on candlestick patterns, Thomas Bulkowski’s “The Encyclopedia of Chart Patterns” is a must-have. I have referred to it countless times while experimenting with trade signals and algorithms, and still have more to learn.
First published in 2000, this guide provides an in-depth look at over 100 different chart patterns. All of the classic setups like Head and Shoulders, Double Top/Bottom, and Cup and Handle are included, along with more nuanced, less-discussed patterns.
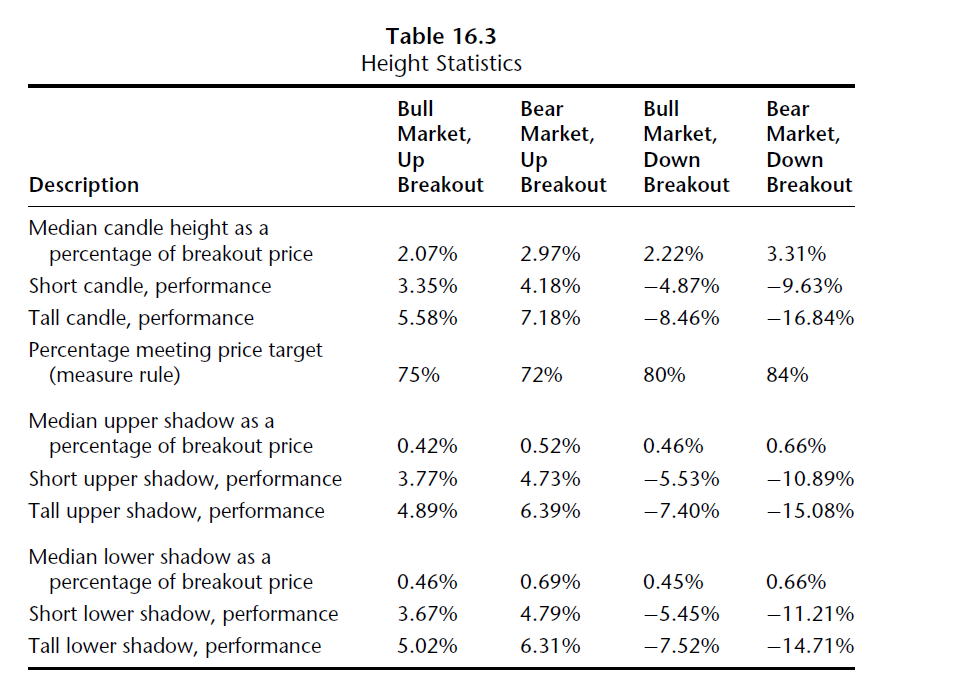
One of the book’s major strengths lies in its empirical grounding. Bulkowski’s approach isn’t purely theoretical. He backs up each pattern description with extensive statistical data gathered from historical markets. Each pattern is described with its statistical success rate, the conditions under which it performs best, and how to use them practically. It’s interesting to see that patterns have an edge built-in, which corroborates the idea of technical analysis as a whole.
Here is a taste of the kind of precision you can expect from Bulkowski’s work.
What may be a drawback, though not to me, is the length. “The Encyclopedia of Chart Patterns” is quite dense and overwhelming for beginners. You mustn’t get the false idea that you need to learn all of these patterns to find success. However, it’s understandable that some beginners will think this way.
Another critique might be the book’s focus on static patterns. In today’s highly algorithmic and dynamic trading environment, static patterns have been beaten into the ground with all kinds of backtesting. You will likely need to apply more conditions to find something new.
“Chart Patterns: After the Buy” by Thomas Bulkowski (2016)

As a follow-up from “The Encyclopedia of Chart Patterns”, Thomas Bulkowski released a more recent publication in 2016. This time, he focuses more on price behavior after a trade is typically taken.
Here, Bulkowski provides detailed, practical guidance on how to trade once a pattern is identified. This is just as crucial as identifying valid chart patterns. Exiting a trade with profit is the ultimate goal, not simply taking the trade. You will learn some strategies for managing risk, determining the size of the trade, and where to take profits.
It’s important to note, though, that both books share a common foundation in their rigorous, data-driven approach. Both books make use of extensive backtesting to validate the performance of the chart patterns they discuss. In both books, Bulkowski provides detailed statistics on the reliability and performance of each pattern, which can be a valuable tool for traders looking to refine their strategies.
“Bollinger on Bollinger Bands” by John Bollinger (2001)

Here’s an authoritative guide on one of the most widely used technical indicators in securities trading – Bollinger Bands. The name refers to a type of statistical chart characterizing the prices and volatility over time of a financial instrument.
Written by the creator of the Bollinger Bands himself, you won’t get a better explanation here. But to sum it up, Bollinger Bands are a volatility indicator. They depict an upper and lower trading channel and help to identify overbought or oversold markets. John Bollinger does a good job exploring its logic and various applications in financial markets.
The book stands out for the depth of its examination. It provides an in-depth analysis of the bands, their construction, and their use. Furthermore, it delves into a range of trading systems that use Bollinger Bands. If you’re looking to develop an algorithm, this is one indicator you could be using.
You should know, however, that the mathematical concepts and trading systems outlined are complex. You can be a beginner at trading, but it’s best to have a decent education in math to fully appreciate some of the calculations. So this book is perhaps better suited for intermediate to advanced traders.
Looking for More?
There are certainly more books than these when it comes to technical analysis. I tried to include the foundation that you should begin with, and if I had to choose one, I’d go with Bulkowski’s. But you’ll have an easier time starting with something more foundational, rather than focusing strictly on one aspect, like candlesticks.
With that said, however, there’s always more to know and more to learn. If you’re interested in learning about the other side of this coin, you may want to look into Fundamental Analysis after this. I’ve compiled a list of some of the best fundamental analysis and trading psychology books. Feel free to check those out next:
Leave a Reply