In addition, any charts for financial instruments in this article are for education only. The examples shown here do not constitute trading advice or a solicitation to buy or sell any financial instrument. Past performance is not necessarily an indication of future performance.
If you would like to learn more, please read this Disclaimer for details.
Doji is a japanese word that means blunder, or mistake. In trading, it refers to a candlestick with an identical, or virtually identical, open and close price.
Perhaps the Japanese considered it a blunder by the market to have an entire trading session with no meaningful result. For technical traders, this ‘mistake’ can have significant consequences.
While the spinning top candlestick sometimes qualifies, the “doji” label applies to any candle with a negligible body. As a result, other candlestick patterns, such as the hammer, inverted hammer, or gravestone, can all also be dojis.
How to Identify the Doji Candlestick Pattern
As you will see when you visit your own charts, a simple doji is more common than other candlestick patterns. This is the case more often with low volume situations and tight price ranges.
When there’s lower volume, enough trades are not being made to push price in either direction. As a result, a stalemate is more commonly the result, especially on the lower time frames.
Take a look at the chart below. Apple (AAPL) prices struggle in this range between $41 and $45 for several weeks.
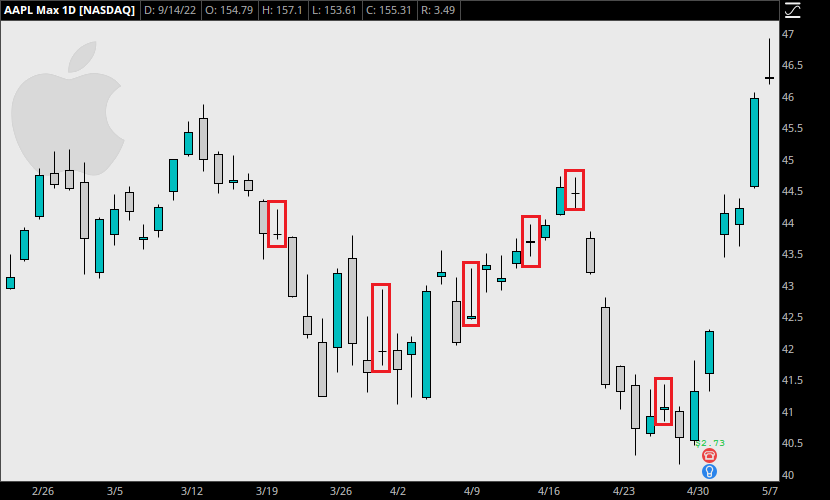
Sellers drive prices lower, while buyers fight to continue the bullish trend. In each of the marked examples, the close price is either equal to or within a few cents of the open price of that day’s trading session.
There are several other unmarked examples that qualify as a doji as well. But considering prices only moved $0.50 during some of these days, it is easier for this pattern to appear in this context.
Due to the tiny body, the doji can stand out during a strong trend. When featuring larger wicks and a body in the center of the candle’s range, we can also label some of these examples as spinning tops, or long-legged dojis.
Market Psychology Behind the Doji Candlestick Pattern
Let me try to read your mind here. If the doji candlestick appears quite often, how can traders know when it’s significant?
Great question! It is absolutely true that this candle pattern can appear frequently in some markets, or during certain market hours. Take a look at the chart below.
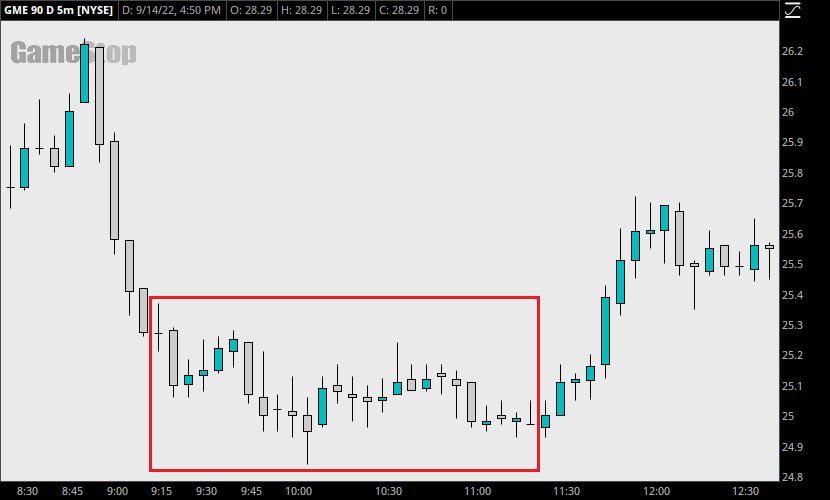
As Gamestop (GME) stock consolidates after an early morning selloff, numerous doji candles appear. A trader who is looking to find a trade may consider taking a trade somewhere in the region enclosed above.
But as with other candlestick patterns, it is not the single candle that tells the whole story. After the market had sold off, the dojis that appear signify that selling pressure had evaporated at these lower prices.
While sellers certainly tried over these two hours to push prices lower, buyers held their ground. Price stayed in this tight range, and ultimately broke out upward to end the day with a short bullish run. Going long in this area would have earned up to 3-4% depending on the precision of the entry and exit. Not bad for 2 hours.
Increasing Reliability of the Doji Candlestick
In short, improving the quality of this signal comes down to applying it correctly. As shown in the above example, it first required patience and acknowledgment of the repeated occurrence of the doji pattern after a steep selloff.
When momentum shifts in moments like these, it often takes time for the effects to play out. By understanding that the doji represents indecision, traders can reconsider their market bias.
They might decide to stay on the sidelines, and not enter a trade until price breaks out of the range, especially if it’s filled with smaller doji candles. There’s no need to take a trade immediately at the first sight of one. This reduces the chance of poor quality trades, and improves overall performance.
The Long-Legged Doji
Another way to improve this candle’s reliability is to seek the long-legged doji instead of the simple doji candlestick. The long-legged doji, sometimes called the “Rickshaw Man“, is just a doji with extended wicks, either above, below, or on both ends. If this variation appears, it shows that traders fought and potentially pushed past significant levels of support and resistance. Ultimately, the market stayed stuck at the same level it opened at, but there is a display of the strength of the bulls, bears, or both.
Because we know that the doji occurs commonly in the market, searching for the long-legged doji instead is a good option for filtering potential trades. All doji candlesticks represent indecision, so finding one with a wider range shows that volatility may have increased during the trading session.
If traders are looking for price to break out of a tight range, increased volatility is one sign of potentially valuable trade setups.
How to Trade Using the Doji Candlestick Pattern
Since the doji represents indecision, it is not a great signal on its own. There are several candlestick patterns that serve as much more valuable signals for entering or exiting positions. But the doji can still be quite useful.
Example Trade
In the following chart, we see Tesla (TSLA) run from $240 to over $380 in from February to April 2022. During this time, buyers pushed price up steadily, creating bullish candles with large bodies. But take a look at the boxed region near the highs.
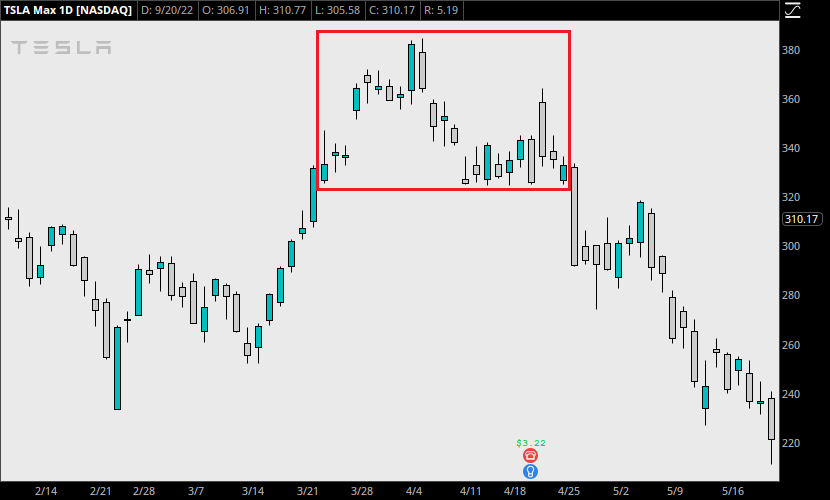
Once price gets in this area, the bodies of the candles shrink. Several doji candlesticks form, along with some other bearish candlestick patterns, such as a bearish inside bar (or harami) at the highs.
For our trader who is looking to short Tesla, it’s a good sign to see price enter this region and begin to show signs of indecision. While the ideal entry for this short does not come from a doji, these dojis do provide vital information when reading the price action.
If our trader looks to get short, they might look for a break outside of the range in this box. Judging by the size of the first bearish candle that comes after the boxed region, many other traders seem to have a similar idea.
Our trader enters short with 10 shares at $322.87, upon breaking the lower level of the range. Their stop might be above the top of the bearish candle, at $333.33. This limits their risk to $104.60.
As price begins to tank, our trader enjoys a swift drop to the lows of $206.86 in late May. But there is a low of $233.33 in late February, which provided the lowest price in many months. Taking profit after the break of this low is a good idea in this case.
Final Numbers
Our trader enters the market with a total position size of 10 shares, valued at $3228.70. With a stop loss at $333.33, our trader risks $104.60 on this trade. Closing the short position at $231.00 realizes a profit of $918.70, a 28.4% gain in under one month.
The risk-to-reward ratio on this trade is 1:8.8, which is exceptional in the stock market.
Conclusion
As shown above, the doji provides key information when preparing for a potential setup. It’s best not to overreact to a single candle, but seeing several in a new price range can spell doom for the underlying trend.
Knowing this, pair the doji candlesticks with other technical indicators to achieve better results. A good understanding of support and resistance, as well as other candlestick patterns like the inside bar and bearish engulfing, for example, can improve the quality of a short.
Once you learn how to spot it, you’ll see the doji appear in numerous contexts, and as part of various other candlestick patterns. Some of these are listed below:
Abandoned Baby
Morning Doji Star
Evening Doji Star
Harami Cross
Tri-Star
Leave a Reply